Solar Irradiance Reconstructions 1610–2025
How much energy does the Sun deliver? What have scientists concluded — and how has that changed?
What the current science shows MODERN
The chart below uses the SATIRE-T reconstruction (Wu et al. 2018), combined with direct satellite measurements from the Community-Consensus TSI Composite (Dudok de Wit et al. 2017) for the satellite era (1978 onward). It is compiled and maintained by Greg Kopp at LASP, University of Colorado, and represents the current scientific consensus view of solar variability since 1610.
Key differences from older reconstructions: the absolute scale is calibrated to the TIM instrument on NASA's SORCE satellite (~1361 W/m²), the sunspot input uses the revised SILSO Version 2 record (Clette et al. 2014), and the Maunder Minimum depression is approximately 1.1 W/m² — much smaller than the ~3 W/m² shown in the Lean (1995/2000) reconstruction below.
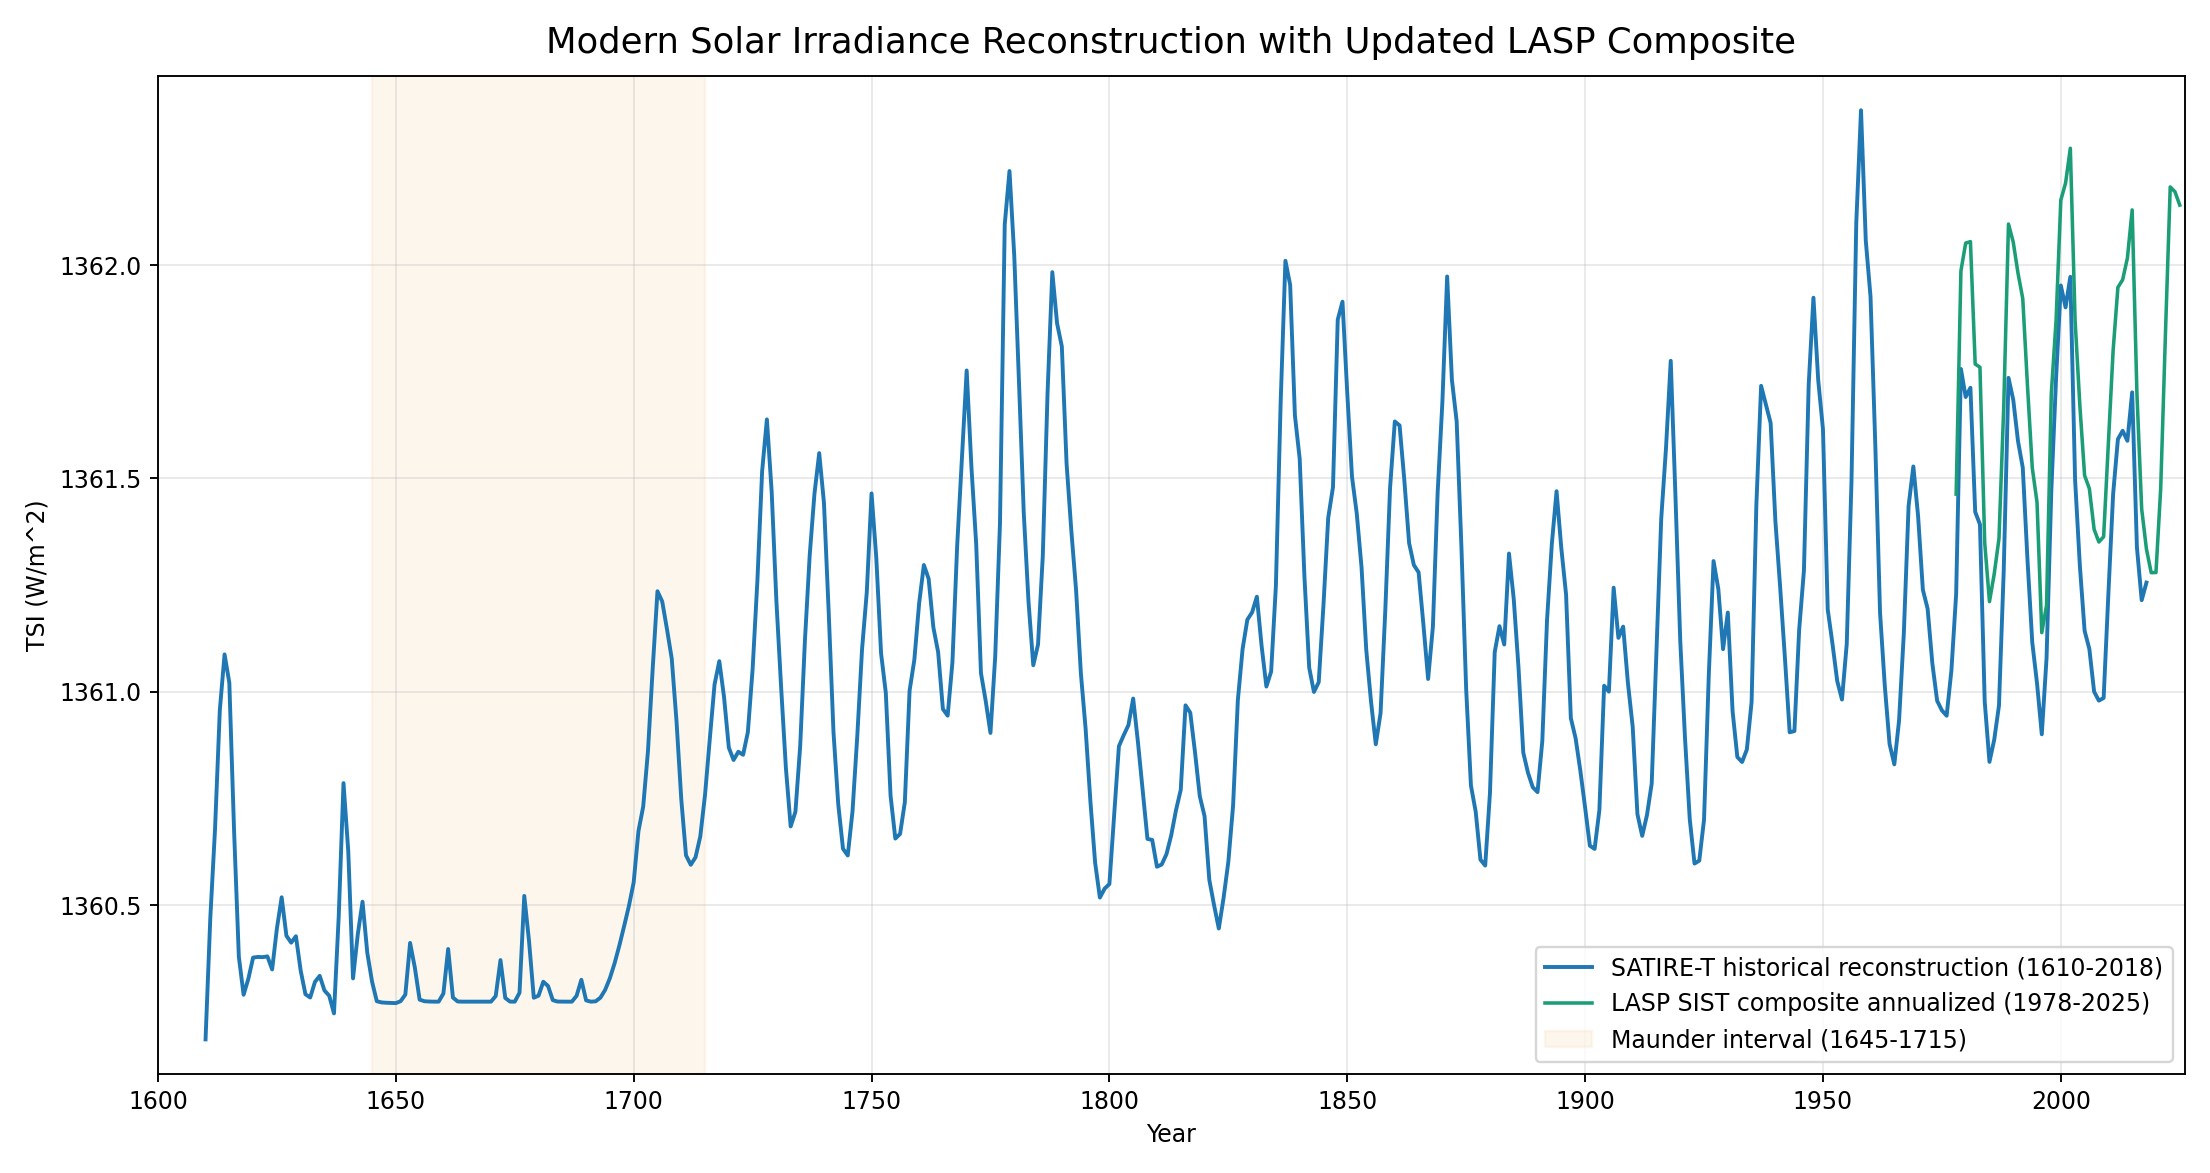
SATIRE-T (Wu et al. 2018) historical segment plus LASP composite observations (Community-Consensus and SIST updates). Compiled by Kopp, LASP/University of Colorado. TIM absolute calibration (~1361 W/m²).
Period covered: 1610–2025
Absolute baseline: ~1361 W/m² (TIM/SORCE calibration)
Maunder Minimum mean TSI: 1360.42 W/m²
Modern era (1978–2025) mean TSI: 1361.71 W/m²
Maunder Minimum depression: ~1.28 W/m² (~0.09% of mean)
Estimated Northern Hemisphere cooling during Maunder Minimum: ~0.1°C
What the current science shows MODERN
The chart below uses the SATIRE-T reconstruction (Wu et al. 2018), combined with direct satellite measurements from the Community-Consensus TSI Composite (Dudok de Wit et al. 2017) for the satellite era (1978 onward). It is compiled and maintained by Greg Kopp at LASP, University of Colorado, and represents the current scientific consensus view of solar variability since 1610.
Key differences from older reconstructions: the absolute scale is calibrated to the TIM instrument on NASA's SORCE satellite (~1361 W/m²), the sunspot input uses the revised SILSO Version 2 record (Clette et al. 2014), and the Maunder Minimum depression is approximately 1.1 W/m² — much smaller than the ~3 W/m² shown in the Lean (1995/2000) reconstruction below.
SATIRE-T (Wu et al. 2018) historical segment plus LASP composite observations (Community-Consensus and SIST updates). Compiled by Kopp, LASP/University of Colorado. TIM absolute calibration (~1361 W/m²).
Period covered: 1610–2025
Absolute baseline: ~1361 W/m² (TIM/SORCE calibration)
Maunder Minimum mean TSI: 1360.42 W/m²
Modern era (1978–2025) mean TSI: 1361.71 W/m²
Maunder Minimum depression: ~1.28 W/m² (~0.09% of mean)
Estimated Northern Hemisphere cooling during Maunder Minimum: ~0.1°C
Notice that the 20th-century "Modern Maximum" — prominent in the older Lean chart — is far less dramatic here. After the revision of historical sunspot numbers (Clette et al. 2014), the apparent long-term upward trend in solar activity from the 18th to 20th century was substantially reduced.
The critical comparison: temperature vs solar activity (both series from 1850)
The question of whether the Sun is driving modern warming is answered most directly by looking at temperature and TSI on the same chart. Below is our version, using HadCRUT5 (Met Office/CRU global surface temperature anomaly; starts in 1850) and SATIRE-T2 (Dasi-Espuig et al. 2014, 2016) extended to 2024 with the Kopp/LASP reconstruction.
The solar irradiance and temperature trends tracked each other reasonably well up to around 1980. Since then, temperature has risen by ~0.7°C while TSI has been flat or slightly declining. The 11-year solar cycle is clearly visible in the yellow line, but there is no net upward solar trend to explain the post-1980 warming. The Sun is not the driver of recent climate change.
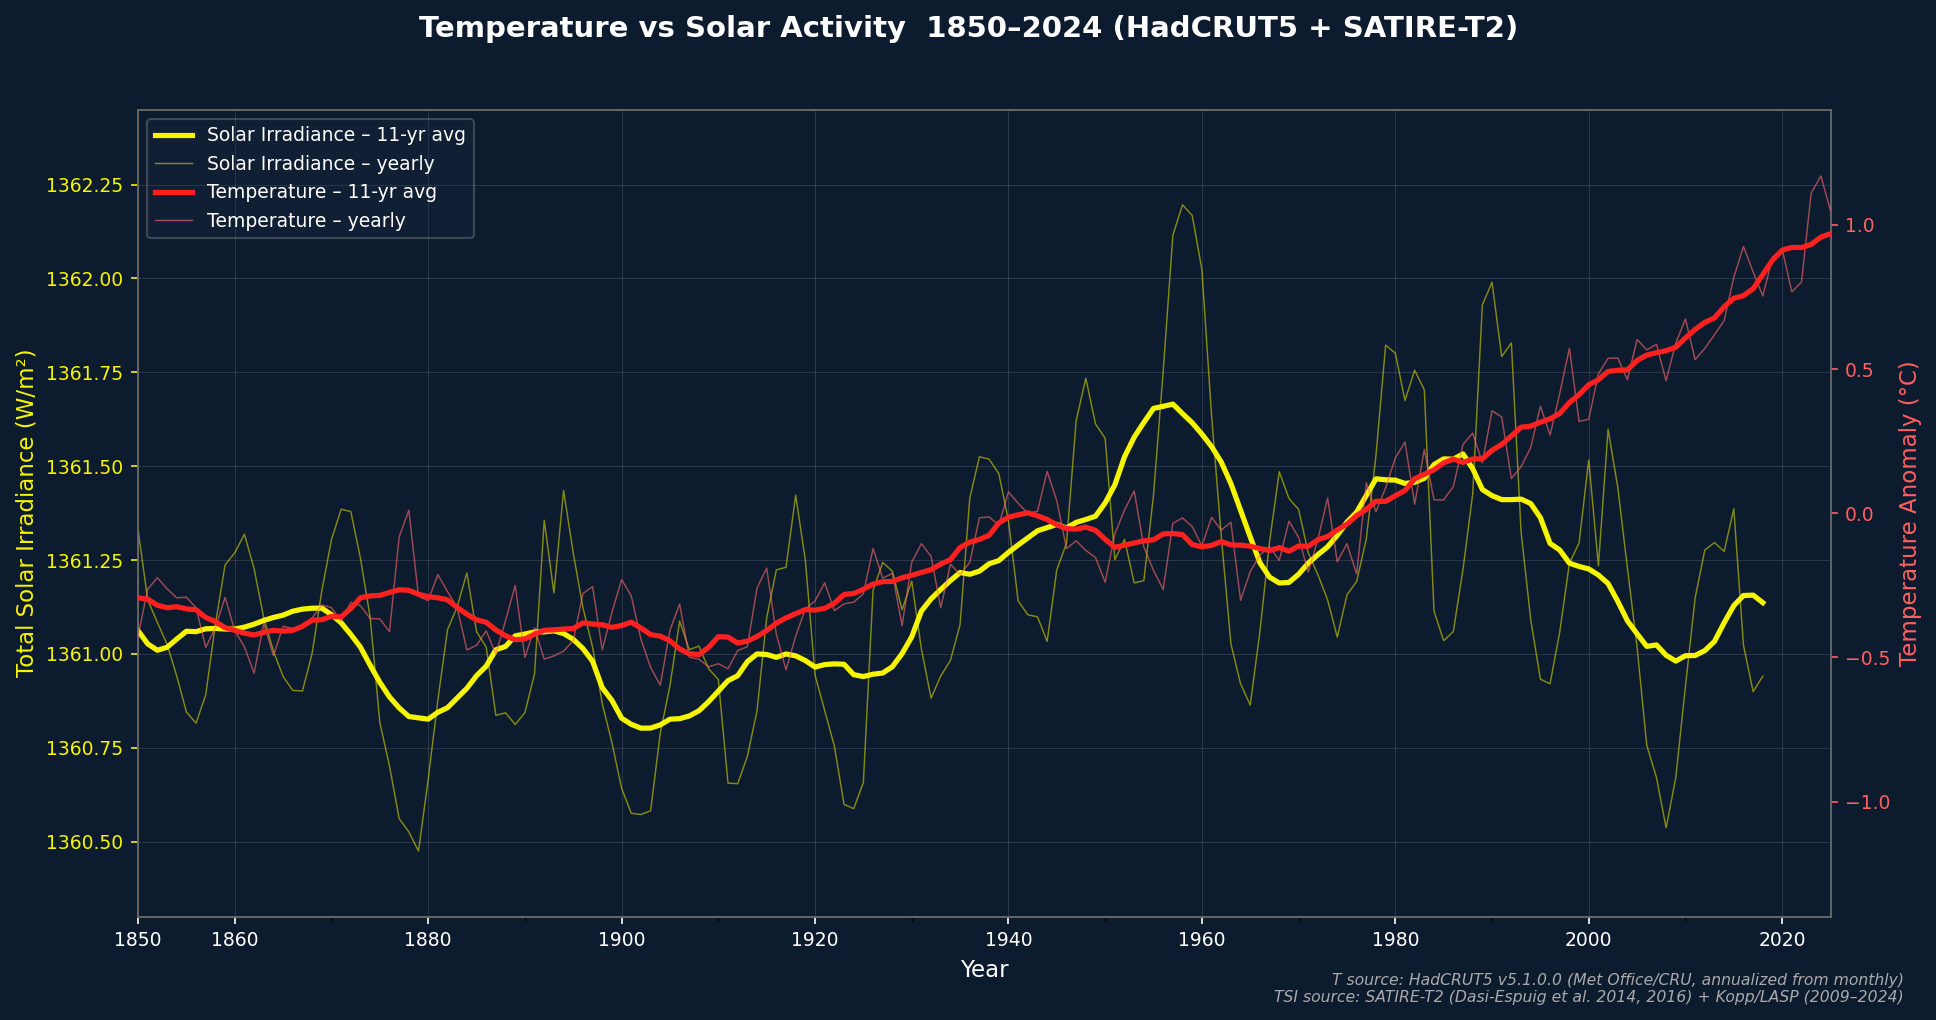
Our version (not NASA's chart) — HadCRUT5 (Met Office/CRU) + SATIRE-T2 (Dasi-Espuig et al. 2014, 2016) + Kopp/LASP (2009–2024). Both temperature and solar series are shown from 1850 onward in this comparison chart. Temperature anomalies use the HadCRUT5 baseline convention (1961–1990).
For comparison, here is the equivalent chart as published by NASA:
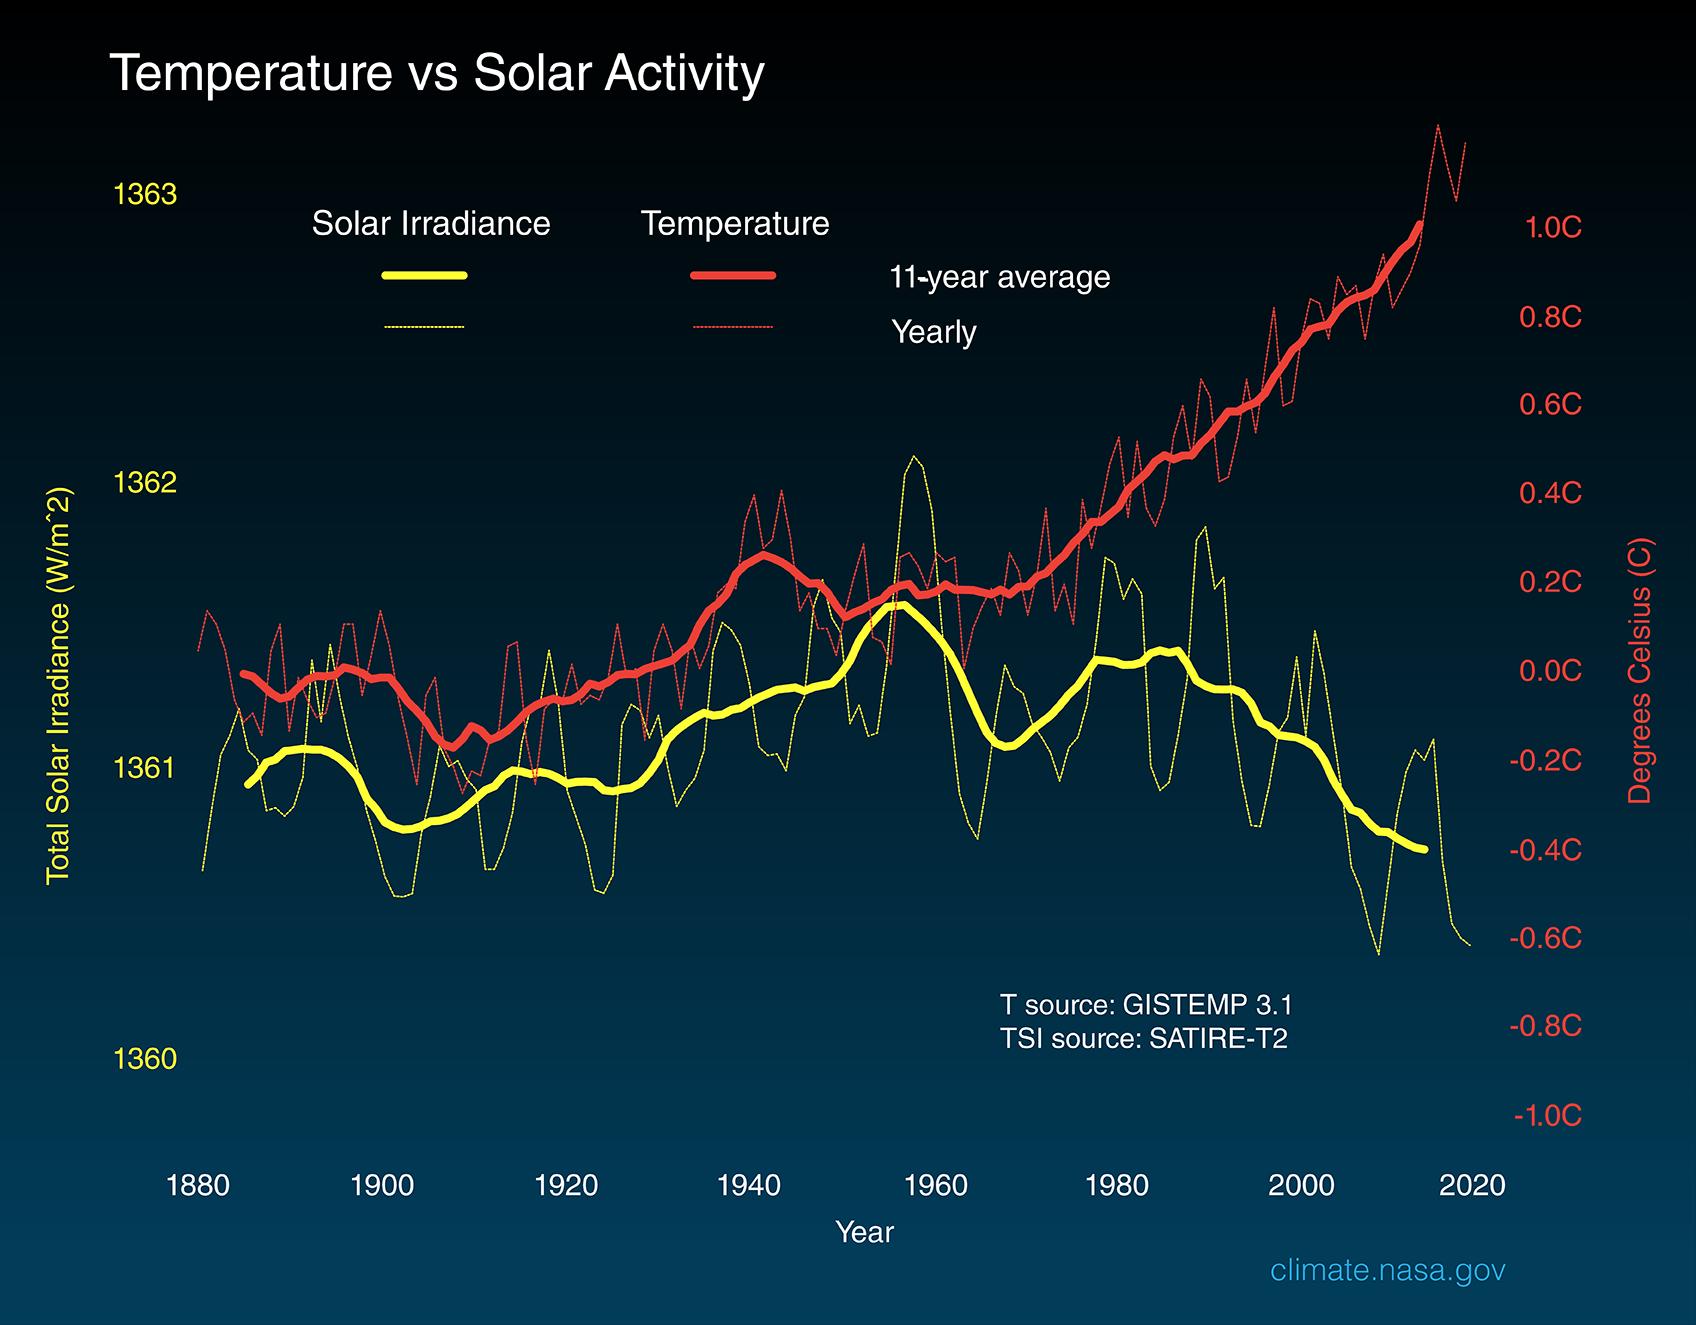
NASA / JPL–Caltech. climate.nasa.gov — Graphic: Temperature vs Solar Activity. T source: GISTEMP 3.1; TSI source: SATIRE-T2. Public domain (NASA).
The earlier reconstruction: Lean et al. (1995/2000) HISTORICAL
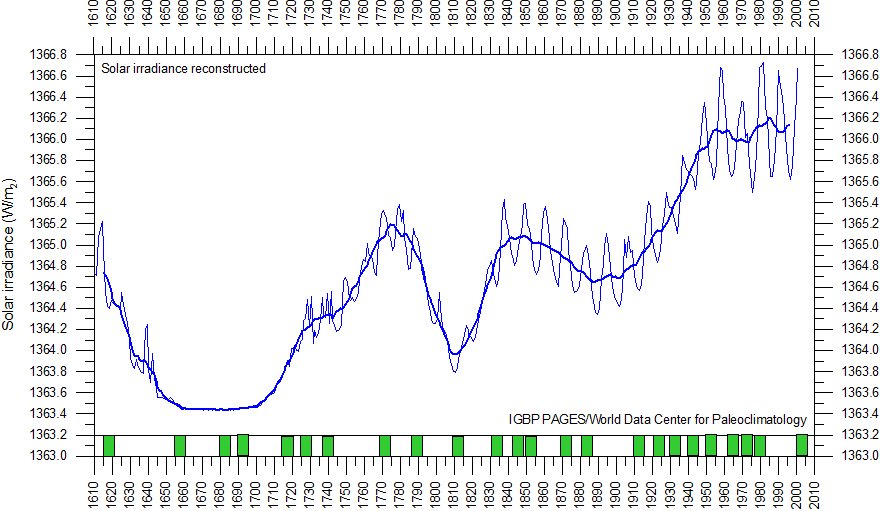
For most of the 1990s and 2000s, the solar irradiance reconstruction by Lean, Beer & Bradley (1995) — later updated in Lean (2000) — was the standard reference. It appeared in IPCC reports, textbooks, and numerous climate studies. The chart below, labelled IGBP PAGES / World Data Center for Paleoclimatology, is an example of how it was widely circulated.
This reconstruction shows a Maunder Minimum TSI depression of roughly 3 W/m² relative to the late 20th century peak, and a clear upward "Grand Modern Maximum" trend through the 20th century. Both features are now considered overestimates.
The original published version
Restored total solar irradiance from 1600 to 2014, originally from Lean, Beer & Bradley (1995), as modified by Easterbrook (2016). Reproduced via Zharkova (2020), Figure 4 (top plot).
Lean JL, Beer J, Bradley R. (1995) Reconstruction of solar irradiance since 1610: implications for climatic change. Geophys Res Lett, 22:3195–3198. Modified by Easterbrook DJ (2016); reproduced via Zharkova V (2020), Temperature, 7:3, 217–222.
Reconstruction from the underlying data
The chart below is generated directly from the Lean 2000 annual irradiance data file archived at NOAA, combined with Solanki et al. (2004) 10-year averaged sunspot numbers. The two blue lines are the same as in the original: a thin line showing the 11-year solar cycle only, and a thick line adding the longer-term background component. The narrow green strip at the bottom indicates active sunspot cycles (sunspot number > 5 in 10-year average) — green means active, white means the Sun was quiet. The Maunder Minimum (1645–1715) gap in the green strip is the most prominent feature.
The Solanki dataset only covers to 1895 AD, so the green strip ends there. The Lean irradiance data runs to 2000.
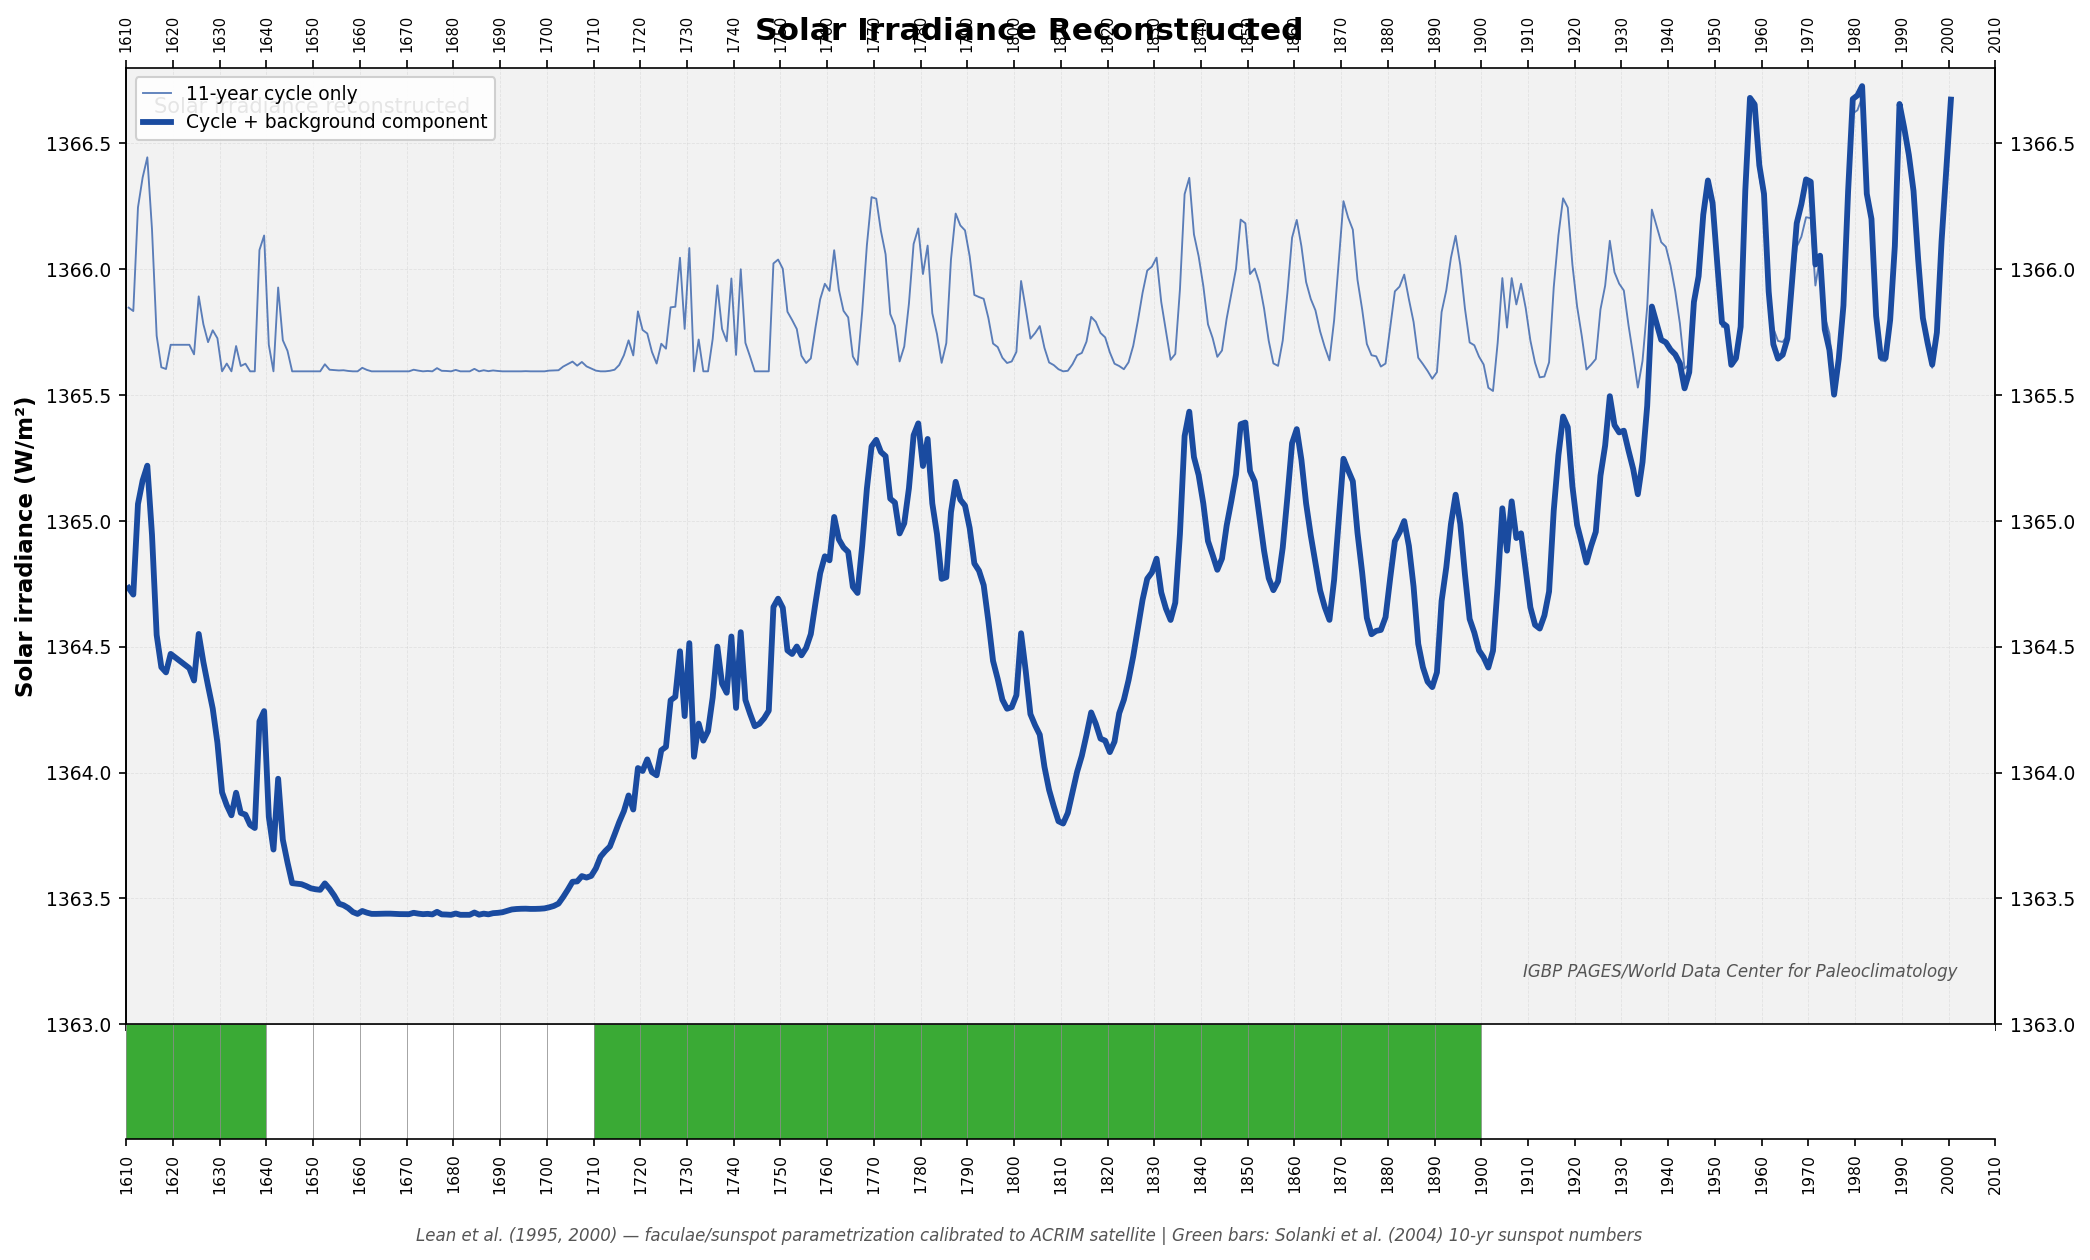
Generated from: Lean (2000) NOAA archive data + Solanki et al. (2004) sunspot numbers. Green bars show 10-year averaged sunspot activity; gap = Maunder Minimum (~1645–1715).
Why do the two reconstructions differ so much?
| Feature | Lean et al. (1995/2000) | SATIRE-T / LASP Composite (2025) |
|---|---|---|
| Absolute TSI baseline | ~1365–1367 W/m² (ACRIM calibration) | ~1361 W/m² (TIM/SORCE calibration) |
| Maunder Minimum depression | ~3 W/m² | ~1.1 W/m² |
| Estimated Maunder cooling (N. hemisphere) | ~0.3–0.5°C | ~0.1°C |
| 20th-century "Grand Modern Maximum" | Prominent upward trend | Much flatter; largely artifact of old sunspot record |
| Sunspot input data | Old SIDC/Zürich record (Version 1) | Revised SILSO Version 2 (Clette et al. 2014) |
| Physical model | Faculae/sunspot parametrization | SATIRE magnetogram-based + satellite composite |
The key driver of the difference is the sunspot record revision. Clette et al. (2014) corrected several historical calibration errors in the international sunspot record, eliminating much of the apparent long-term rise from the 18th to 20th century. This in turn reduced the reconstructed background solar forcing — both the Modern Maximum and the depth of the Maunder Minimum trough.
A secondary factor is the absolute calibration of TSI instruments. The ACRIM composite (used in Lean 1995/2000) has a known positive bias relative to TIM, resulting in a baseline about 4–6 W/m² higher, though this does not directly change the relative Maunder-to-modern difference.
Data sources
Wu CJ, Usoskin IG, Krivova N, et al. (2018). "Solar activity over nine millennia: A consistent multi-proxy reconstruction." Astronomy & Astrophysics, 615, A93.
Dudok de Wit T, Kopp G, Fröhlich C, Schöll M (2017). "Methodology to create a new total solar irradiance record." Geophys Res Lett, 44:1196–1203.
Compiled by Kopp G, LASP/University of Colorado. Data: LASP Historical TSI Reconstruction
Temperature vs Solar Activity charts:
Temperature: GISTEMP v4, NASA GISS Surface Temperature Analysis. data.giss.nasa.gov/gistemp
TSI: SATIRE-T2 — Dasi-Espuig M, Jiang J, Krivova NA, Solanki SK (2014). "Modelling total solar irradiance since 1878 from simulated magnetograms." A&A 570, A23. Dasi-Espuig M et al. (2016). "Reconstruction of spectral solar irradiance since 1700." A&A 590, A63.
MPS SATIRE-T2 data
NASA reference chart: science.nasa.gov (public domain)
Lean et al. irradiance:
Lean J (2000). "Evolution of the Sun's Spectral Irradiance Since the Maunder Minimum." Geophys Res Lett, 27(16):2425–2428.
Lean J, Beer J, Bradley R (1995). "Reconstruction of Solar Irradiance Since 1610." Geophys Res Lett, 22(23):3195–3198.
NOAA Paleoclimatology archive
Sunspot data:
Solanki SK, Usoskin IG, Kromer B, Schüssler M, Beer J (2004). "An unusually active Sun during recent decades." Nature, 431:1084–1087.
NOAA Paleoclimatology archive
Sunspot number revision:
Clette F, Svalgaard L, Vaquero JM, Cliver EW (2014). "Revisiting the sunspot number." Space Science Reviews, 186:35–103.
Reference image source:
Zharkova V (2020). "Modern Grand Solar Minimum will lead to terrestrial cooling." Temperature, 7:3, 217–222. DOI: 10.1080/23328940.2020.1796243. Figure 4 (top panel).