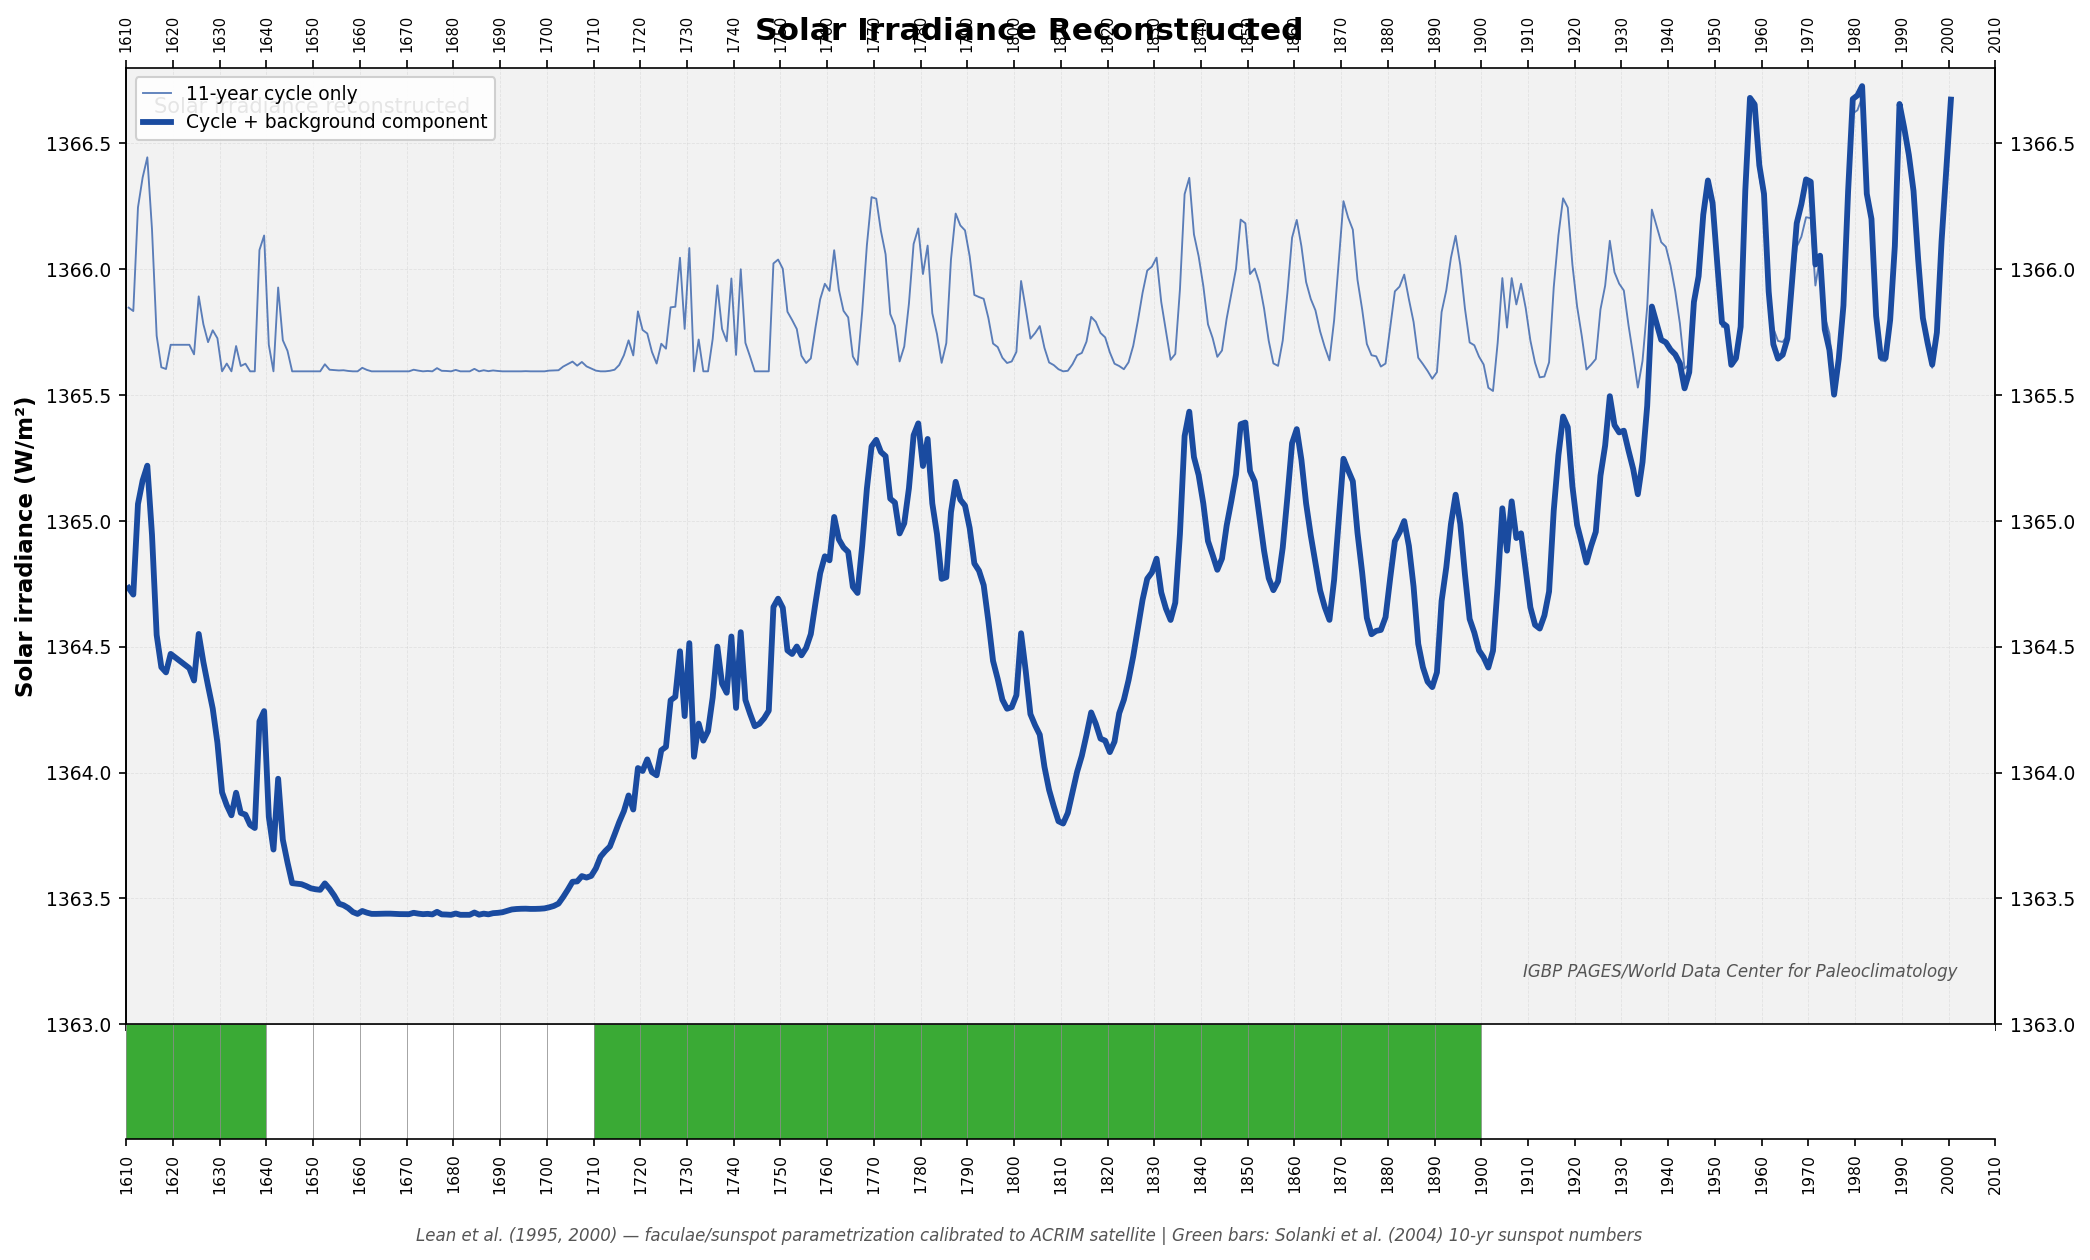
Solar Irradiance Reconstructed
Historical solar energy output reconstruction from 1610 to present
About the Green Bars
The green bars in the narrow strip at the bottom indicate periods of active solar cycles (sunspot number > 5). The most important feature is the gap from ~1645 to 1715 — the Maunder Minimum, when the Sun almost completely stopped producing sunspots for 70 years. This coincides with the coldest part of the Little Ice Age. The Solanki et al. (2004) 10-year averaged sunspot data only extends to 1895 AD; after that the bars are absent because no data was available for that dataset.
Original Reference Chart
Restored total solar irradiance from 1600 to 2014 by Lean, Beer & Bradley (1995), as modified by Easterbrook (2016). Reproduced from Zharkova (2020), Figure 4 (top plot). The lower panel in the original shows Central England Temperatures (CET) since 1658.
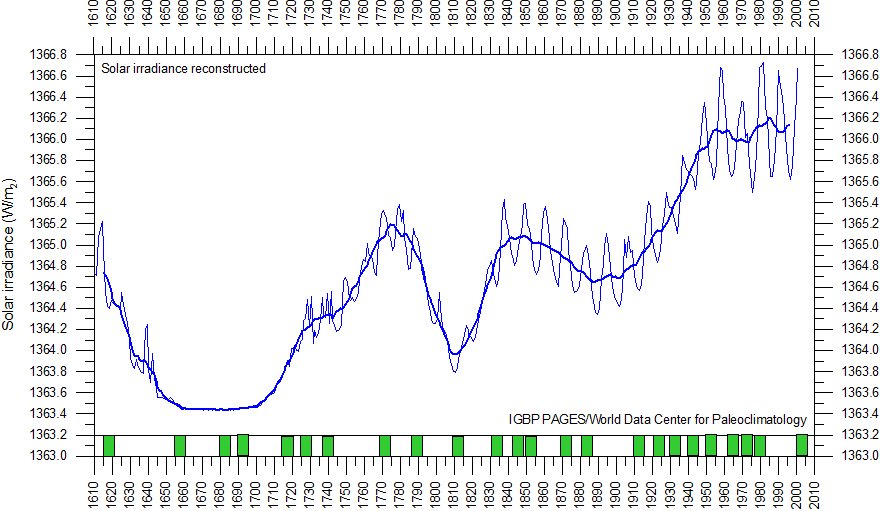
Lean JL, Beer J, Bradley R. (1995) Reconstruction of solar irradiance since 1610: implications for climatic change. Geophys Res Lett, 22:3195–3198. Modified by Easterbrook DJ (2016); reproduced via Zharkova V (2020), Temperature, 7:3, 217–222.
About This Chart
This reconstruction of solar irradiance spans 400 years (1610–2000 AD), based on the Lean et al. (1995, 2000) parametrization of solar activity using observations of sunspot darkening and facular brightening. The chart displays two components: an 11-year cycle (thin line) reflecting the well-known Schwabe solar cycle, plus a longer-term background component (thick line) that captures multi-decade and century-scale variations. The green bars show Solanki et al. (2004) reconstructed sunspot numbers, which correlate with solar activity strength.
Key Features
- Maunder Minimum: The lowest irradiance values (~1363.3 W/m²) appear around 1688, corresponding to the Maunder Minimum—a period of greatly reduced sunspot activity lasting from roughly 1645 to 1715.
- Medieval Warm Period: A period of relatively high irradiance around 1200 AD may correlate with the Medieval Warm Period.
- Little Ice Age: The extended period of low irradiance from 1450-1750 correlates with the Little Ice Age and global cooling of approximately 0.5-1°C.
- Modern Period: The 20th century shows a warming trend with higher and more variable irradiance values.
Time Period: 1610 – 2000 AD
Minimum TSI: 1363.435 W/m² (year 1679)
Maximum TSI: 1366.728 W/m² (year 1981)
Range: ~3.3 W/m² (~0.25% of mean)
Maximum Sunspot Number: 55.0 (1865)
Scientific Interpretation
While solar irradiance changes of this magnitude might seem small, they have significant climatic impacts. The Maunder Minimum's irradiance minimum contributed to the cold conditions of the Little Ice Age. Conversely, higher solar forcing during the Medieval Warm Period supported warmer conditions.
Modern climate science accepts an absolute TSI baseline closer to 1361 W/m² (rather than ~1367 W/m² in this older calibration). Nevertheless, what matters for climate forcing is the variation and anomalies relative to a baseline, making this reconstruction valuable for understanding historical solar influence on climate.
Methodology
The Lean et al. reconstruction combines parametrized observations of two solar magnetic phenomena:
- Facular Brightening: Bright regions on the solar surface that increase irradiance during high solar activity
- Sunspot Darkening: Dark regions that reduce irradiance despite active conditions
- Net Effect: The brightening of faculae dominates during active periods, increasing total irradiance
The reconstruction is calibrated to match modern satellite observations (ACRIM) and validated against independent solar activity proxies. The two-component model separates the periodic 11-year Schwabe cycle from longer-term variations, allowing for analysis of both short-term oscillations and decadal/centennial trends.
Lean, J. (2000). "Evolution of the Sun's Spectral Irradiance Since the Maunder Minimum." Geophysical Research Letters, Vol. 27, No. 16, pp. 2425–2428.
Original reference: Lean, J., Beer, J., and Bradley, R. (1995). "Reconstruction of Solar Irradiance Since 1610: Implications for Climate Change." Geophysical Research Letters, v.22, No. 23, pp. 3195–3198.
Sunspot Data Source — Solanki et al.:
Solanki, S.K., Usoskin, I.G., Kromer, B., Schüssler, M., and Beer, J. (2004). "An unusually active Sun during recent decades compared to the previous 11,000 years." Nature, Vol. 431, pp. 1084–1087.
Archive: NOAA Paleoclimatology Program — Solar Variability Data
Additionally, the prominent "Grand Modern Maximum" visible in this chart (the sharp rise in TSI through the 20th century) has been questioned since the sunspot number revision by Clette et al. (2014), which found the upward trend in solar activity between the 18th and 20th centuries had been overstated.
The Lean 2000 data plotted here are therefore considered an upper-bound estimate of solar forcing. More recent assessments favour a smaller solar contribution to 20th-century warming and a smaller Maunder Minimum cooling effect (~0.1°C vs. ~0.3–0.5°C in older estimates).