Modern Reconstruction vs Lean 2015 vs CMIP5 + LASP SIST
Total Solar Irradiance (TSI), annual values, 1610 onward
Direct Comparison NO +5 SHIFT
This page compares TSI reconstructions on the same native scale: the LASP modern reconstruction (SATIRE-T plus Community-Consensus composite, as compiled by Greg Kopp) , the NASA GISS Lean 2015 post-CMIP5 series, the CMIP5-era GISS series based on WLS 2005, and the newer LASP SIST composite (annualized from daily values).
In this chart, "modern reconstruction" refers to the local Kopp/LASP file currently ending at 2018 in this dataset.
Unlike the NASA GISS overlay figure labelled "Lean (2015) (+5 W/m^2)", this chart does not apply any vertical offset. All series are plotted in absolute TSI units around 1361 W/m^2.
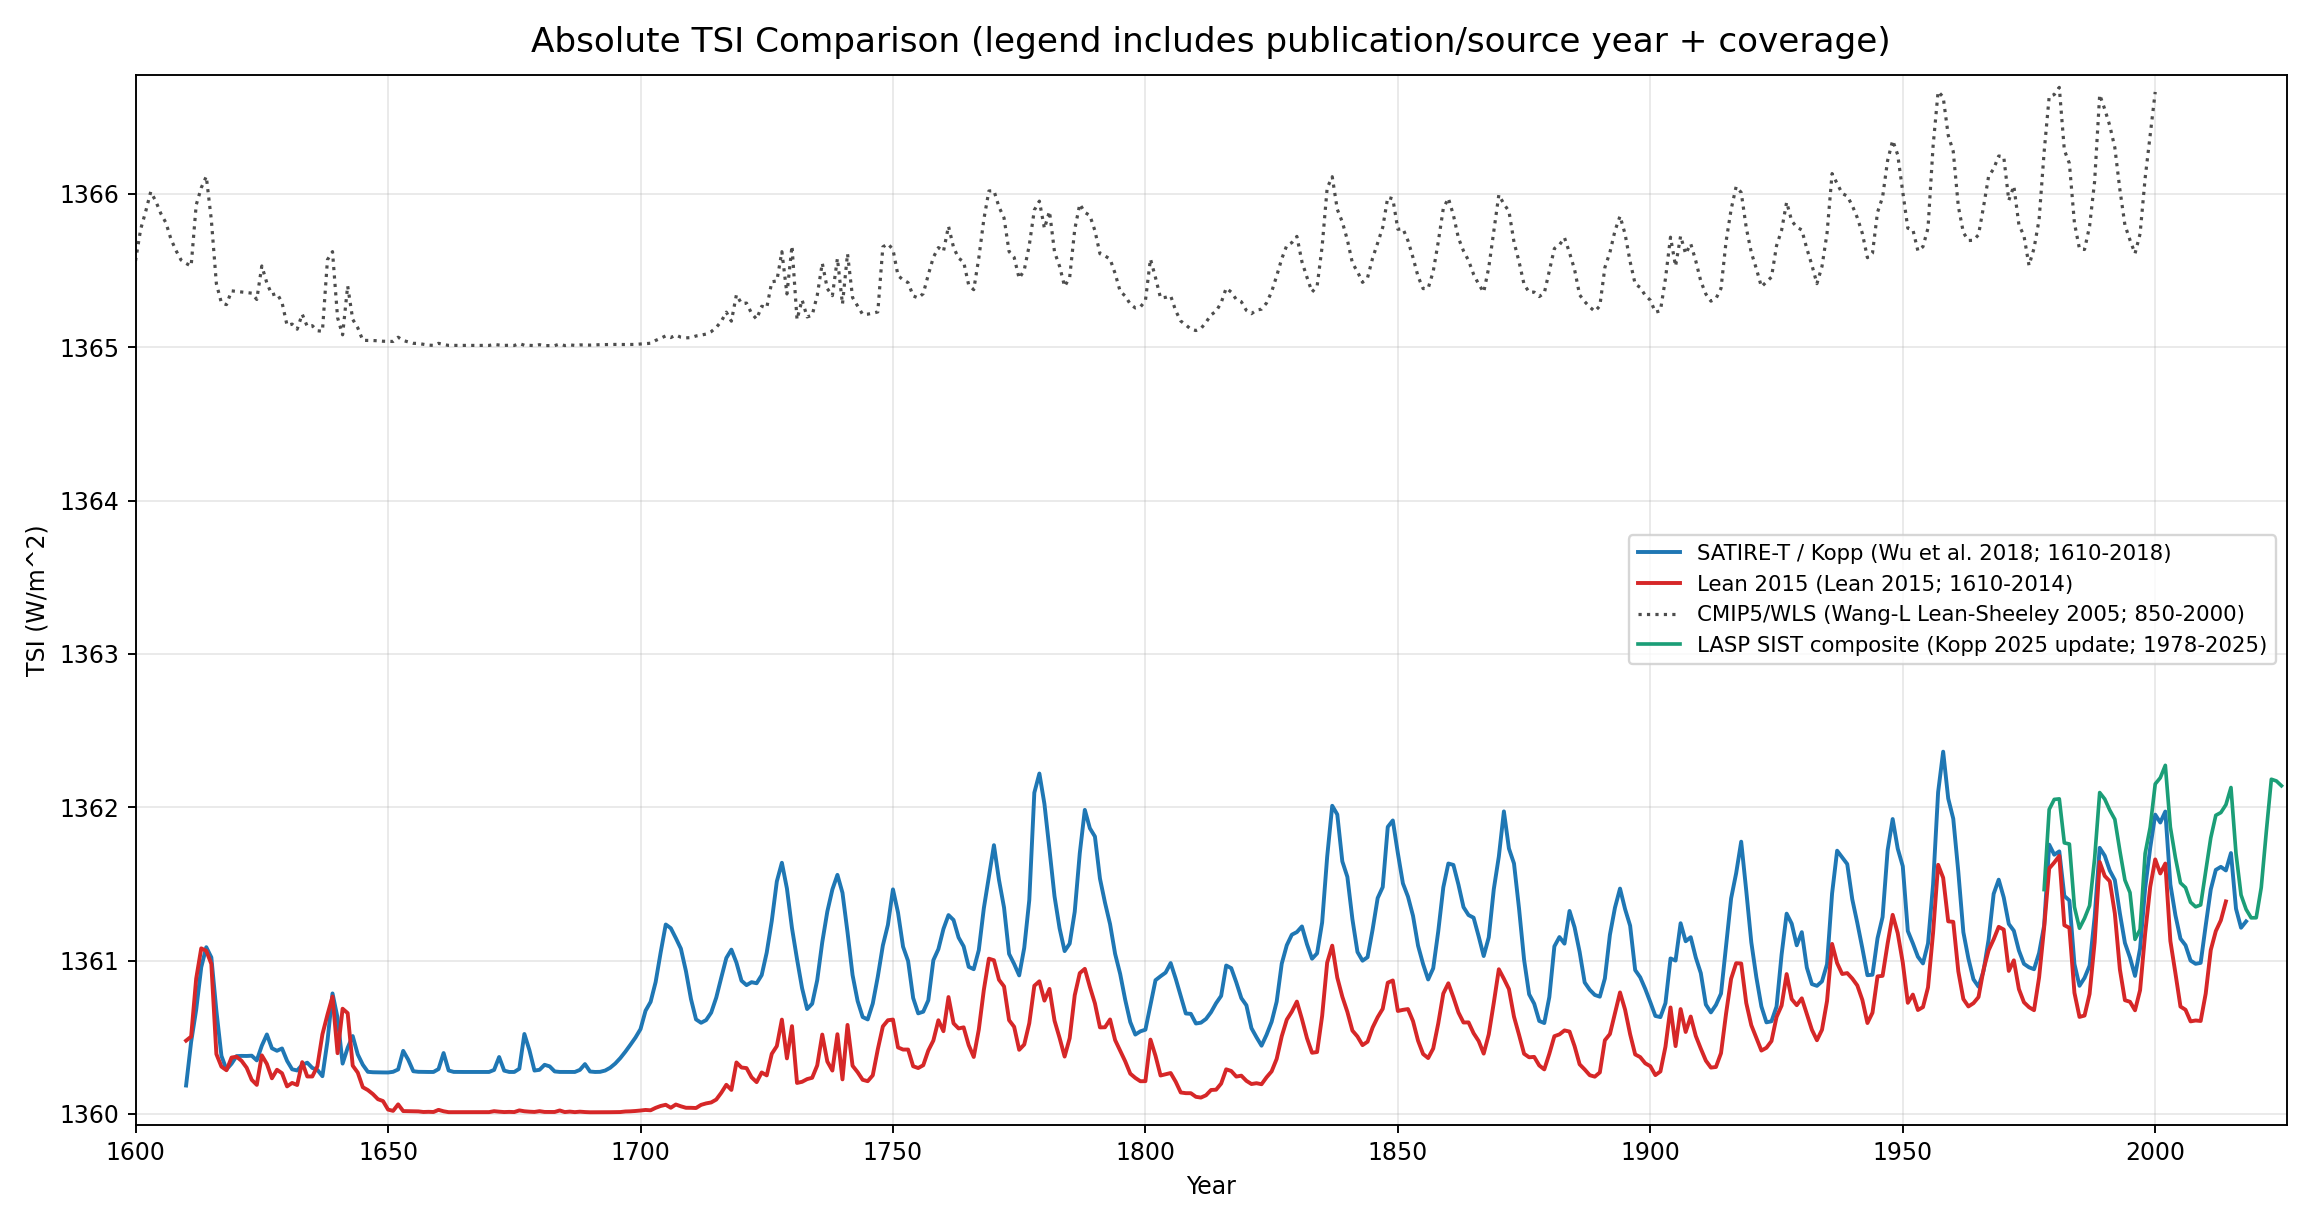
Blue: SATIRE-T / Kopp (Wu et al. 2018; 1610-2018). Red: Lean 2015 (Lean 2015; 1610-2014). Dotted charcoal: CMIP5/WLS (Wang-L Lean-Sheeley 2005; 850-2000). Green: LASP SIST composite (Kopp 2025 update; 1978-2025). All shown on native absolute scale; no visual baseline shift.
How to read this chart
- All series include the 11-year solar cycle signal.
- The blue modern reconstruction has a larger cycle amplitude than Lean 2015 in many periods.
- The red Lean 2015 line ends in 2014, while the modern reconstruction here continues to 2018.
- The green LASP SIST line extends the modern observational composite through 2025.
- The dotted CMIP5 line uses the earlier WLS 2005-based forcing baseline and extends to 2000 in the GISS file.
- Absolute differences between curves reflect reconstruction methodology, calibration choices, and proxy handling.
Normalized comparison (anomaly view)
To remove baseline offsets, the chart below shows anomalies relative to each series mean over 1850-2000. This reveals shape differences without the absolute W/m² level differences.
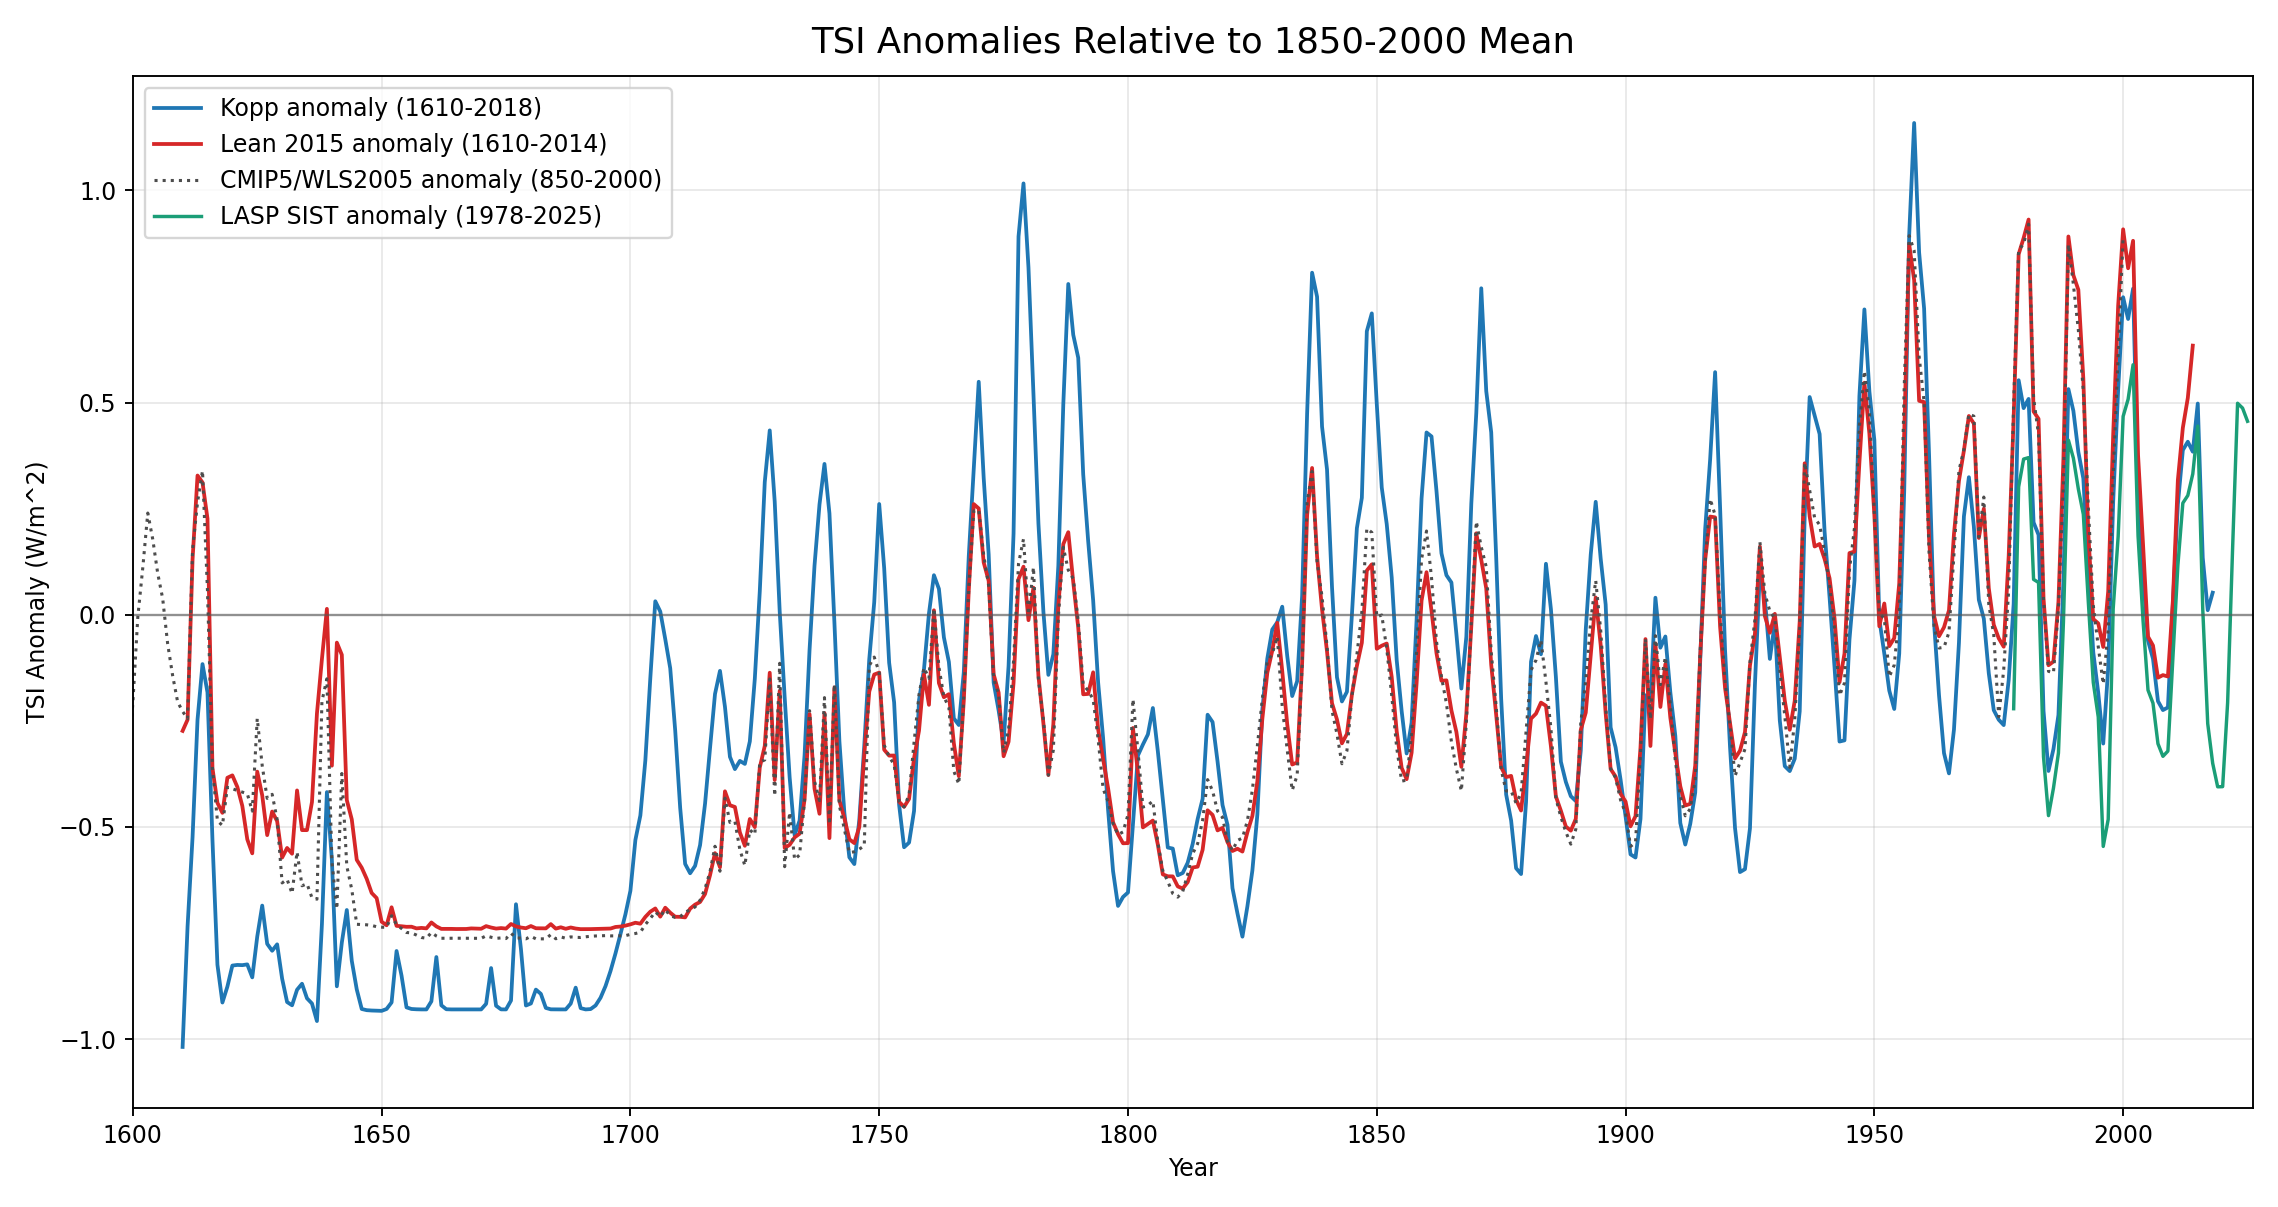
Anomalies relative to each series mean over 1850-2000, with dated legend entries for Kopp/LASP (1610-2018), Lean 2015 (1610-2014), CMIP5/WLS2005 (850-2000), and LASP SIST (1978-2025).
Quantitatively, over their shared 1610-2000 period in this processing run, Lean 2015 vs CMIP5 gives correlation r = 0.984 and RMSE 0.067 W/m². So your intuition is mostly right: they nearly overlap in anomaly space, but small differences remain.
Modern reconstruction file (local copy):
kopp_tsi_reconstruction.txtOriginal source: LASP Historical TSI Reconstruction
Newer LASP composite file (local copy):
tsi_composite_sist.txtOriginal source: LASP TSI Composite (SIST)
Lean 2015 file:
NASA GISS post-CMIP5 Lean 2015 dataset
CMIP5-era GISS file (WLS 2005-based):
NASA GISS CMIP5 TSI dataset