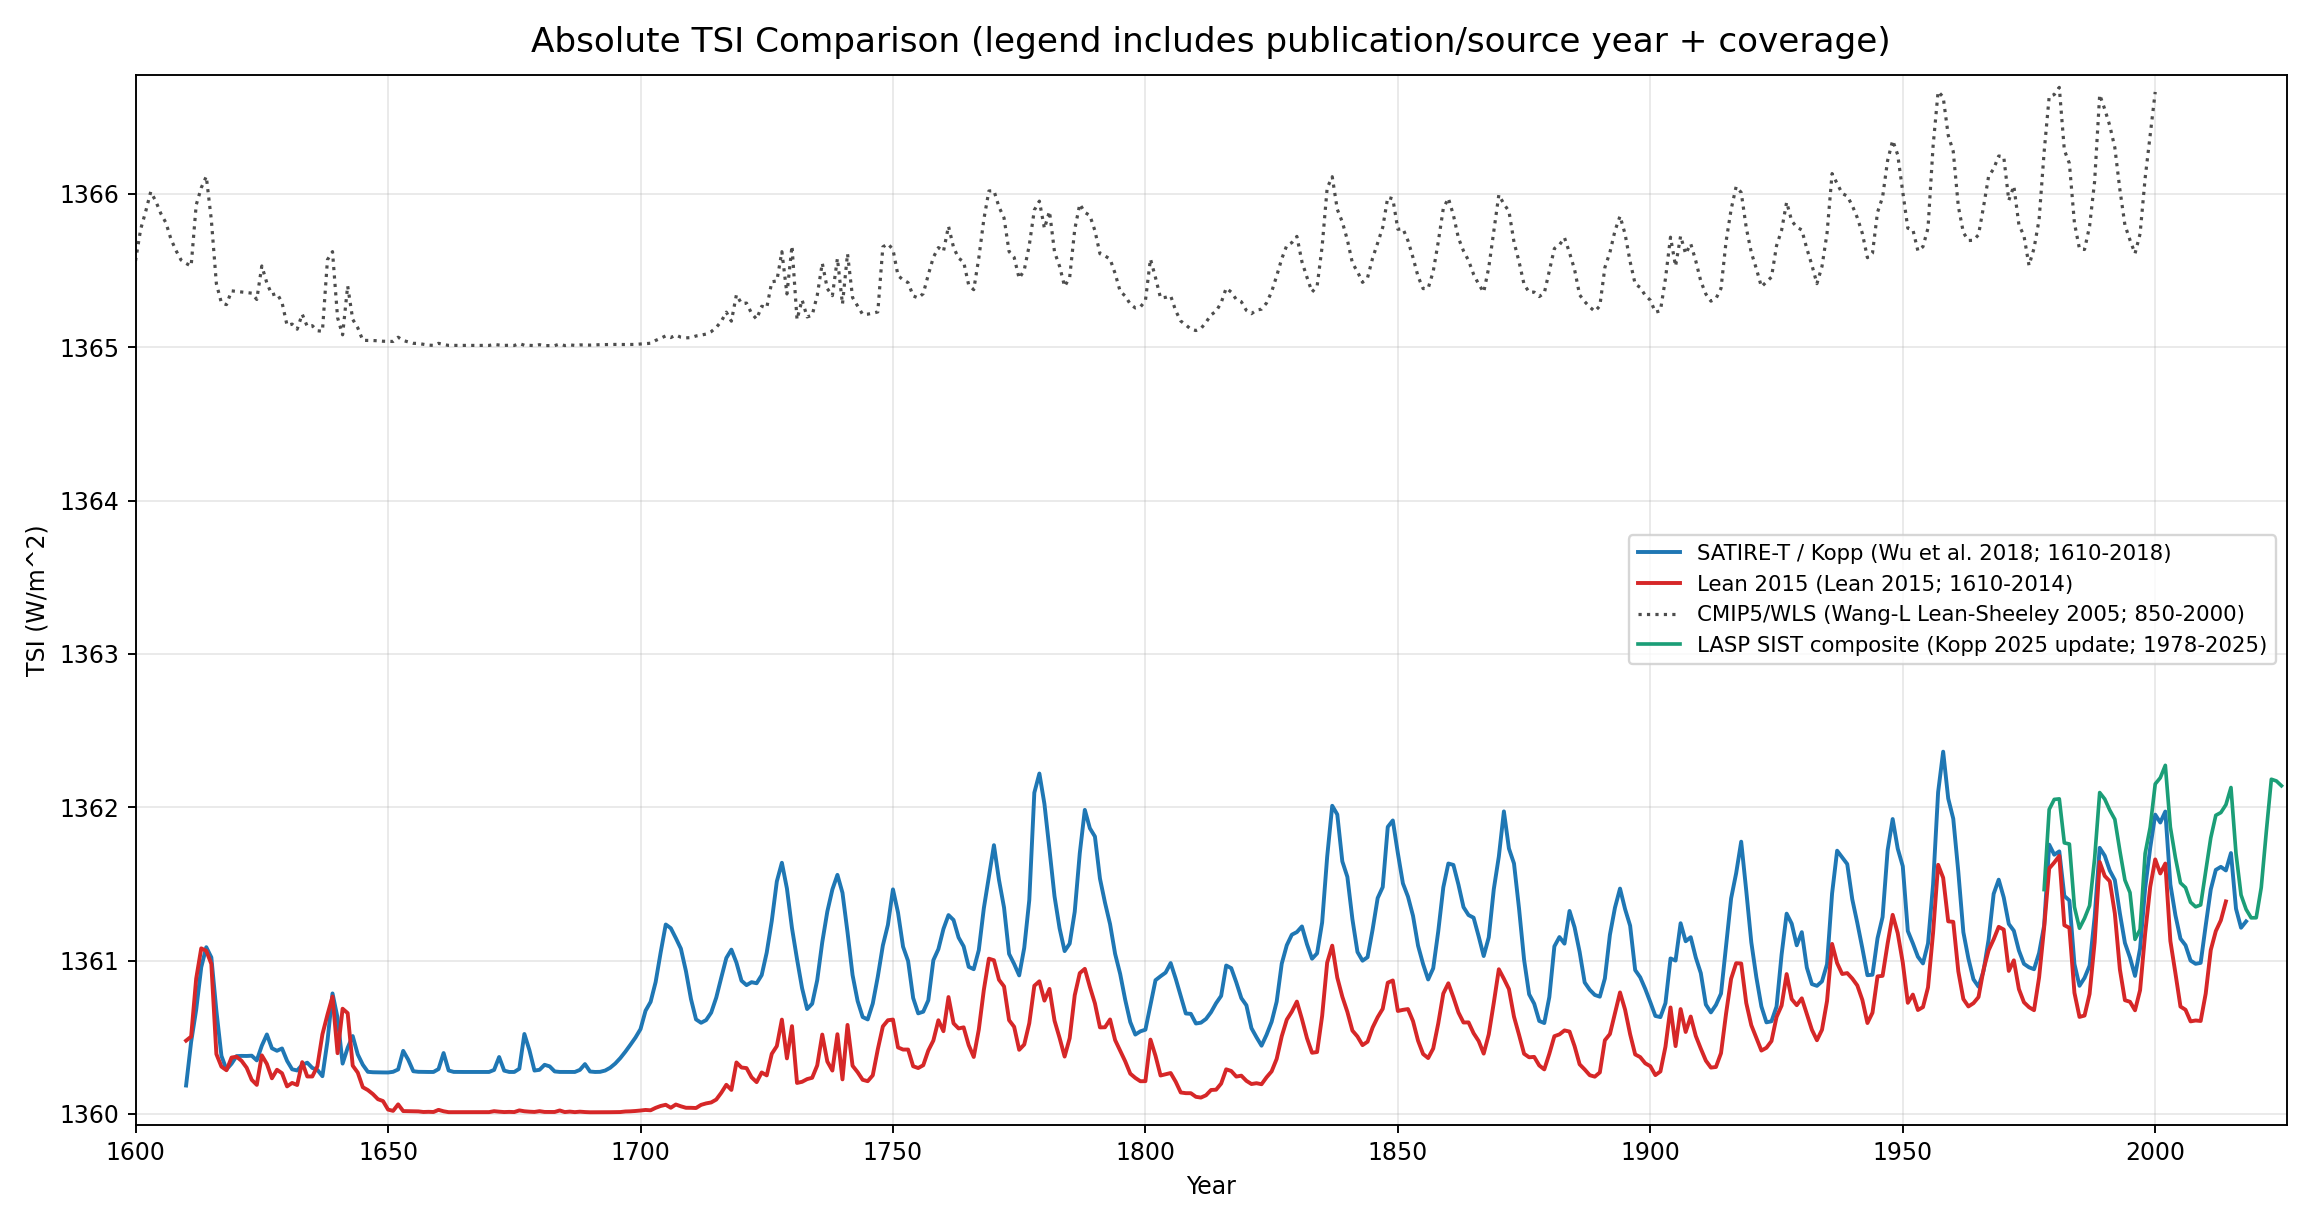
Native absolute scale, no +5 W/m² display shift. Legend labels now include both publication/source year and coverage range (for example: "Wu et al. 2018; 1610-2018").
Modern reconstruction, Lean 2015, CMIP5 baseline, and SATIRE-T2 plus Kopp/LASP extension
This page combines the three existing solar irradiance plots with a new SATIRE-T2 chart that is extended using the Kopp/LASP reconstruction after 2008.
Native absolute scale, no +5 W/m² display shift. Legend labels now include both publication/source year and coverage range (for example: "Wu et al. 2018; 1610-2018").
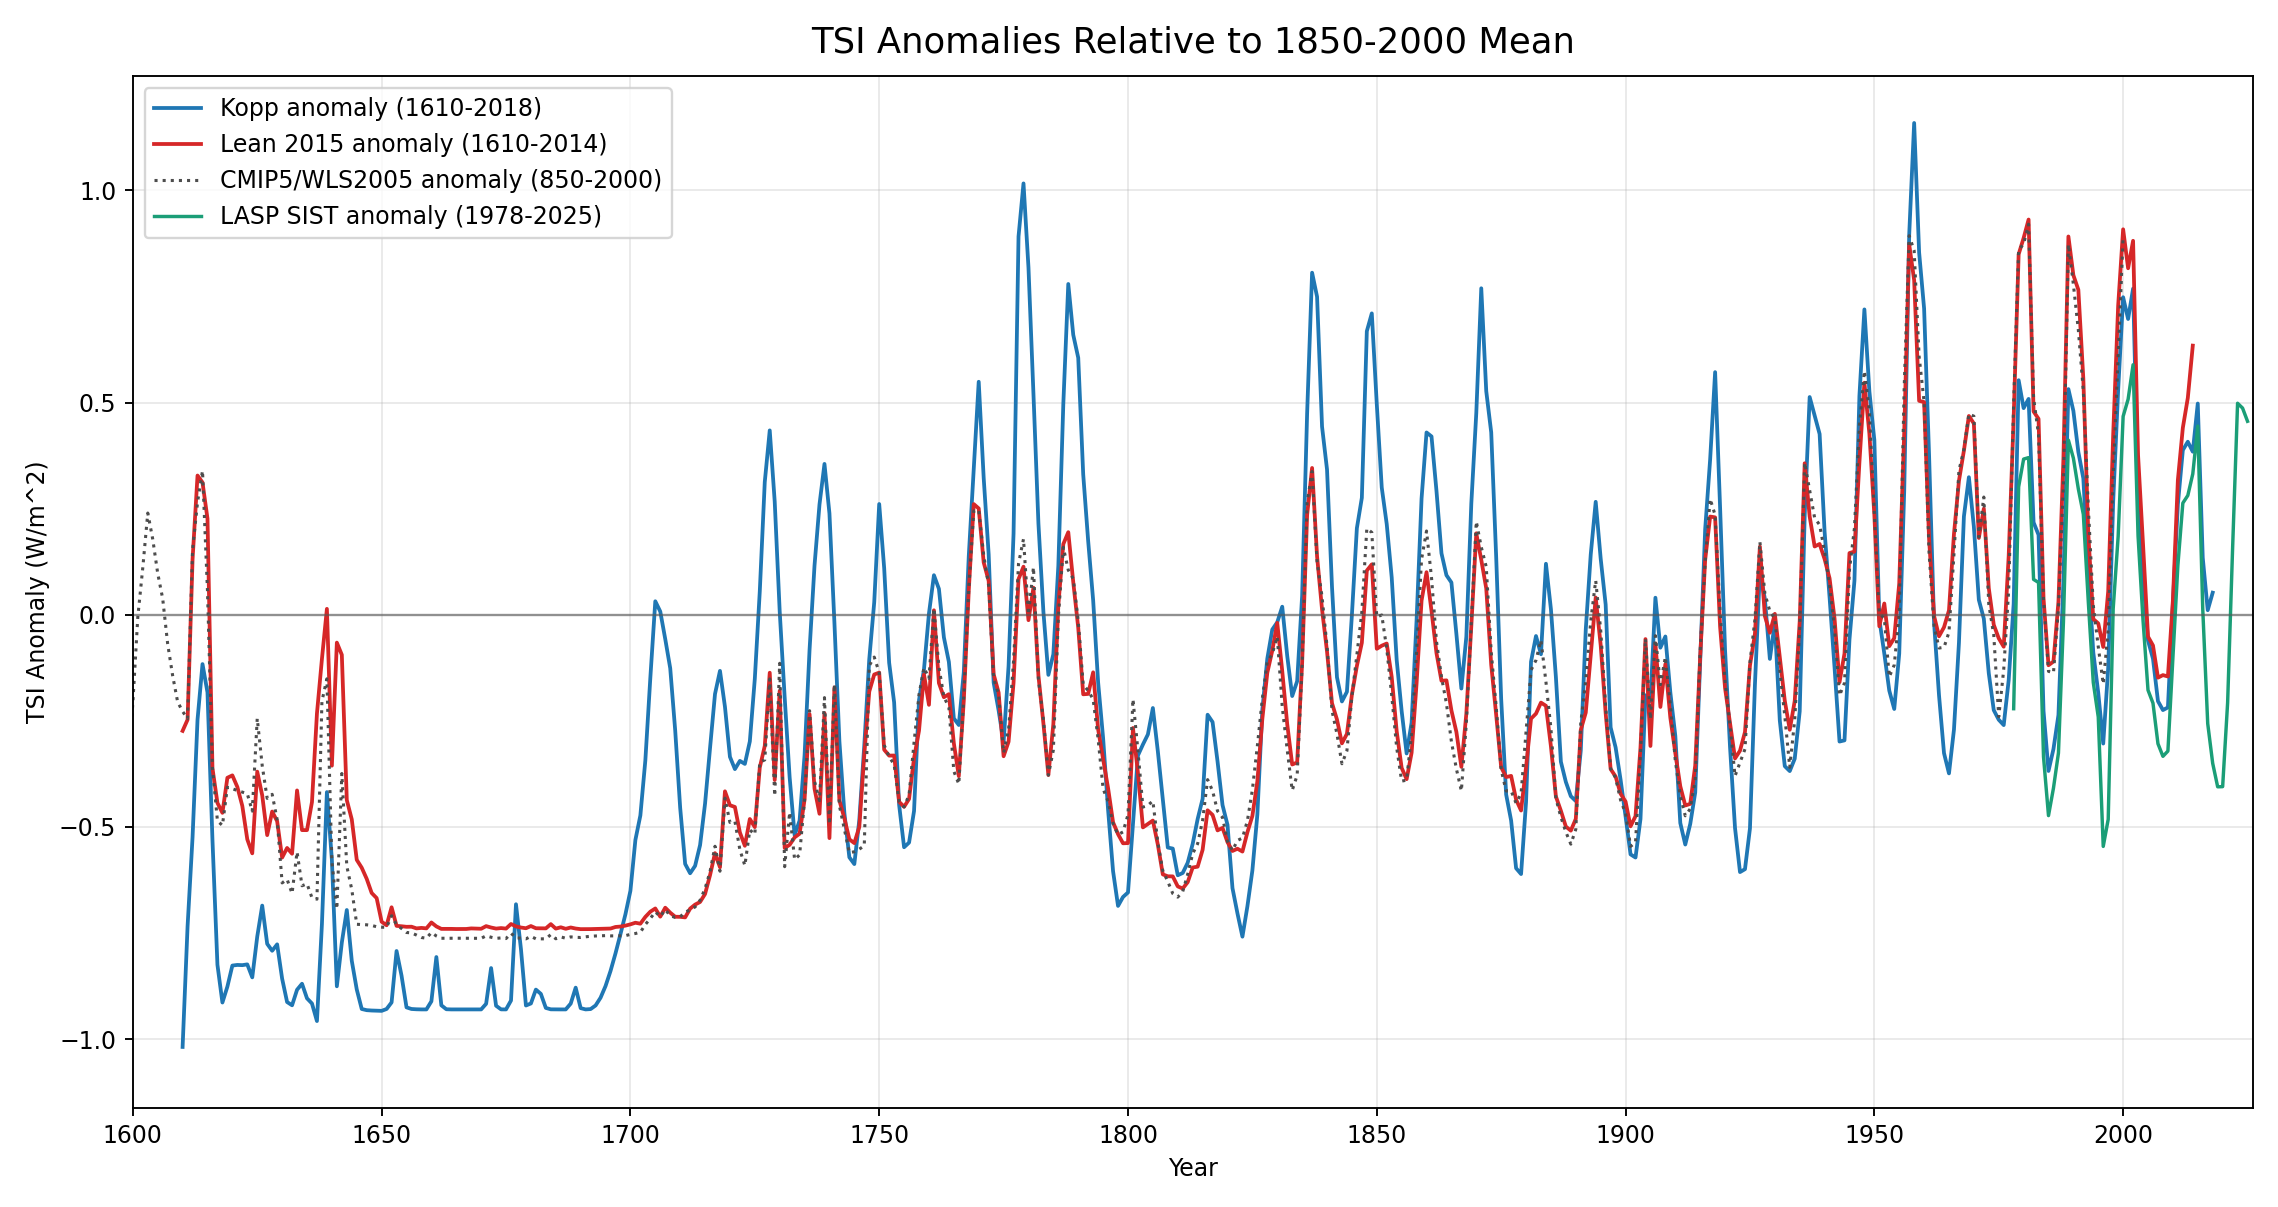
Anomaly-normalized view to compare shape without absolute baseline offsets, now including LASP SIST anomaly values through 2025.
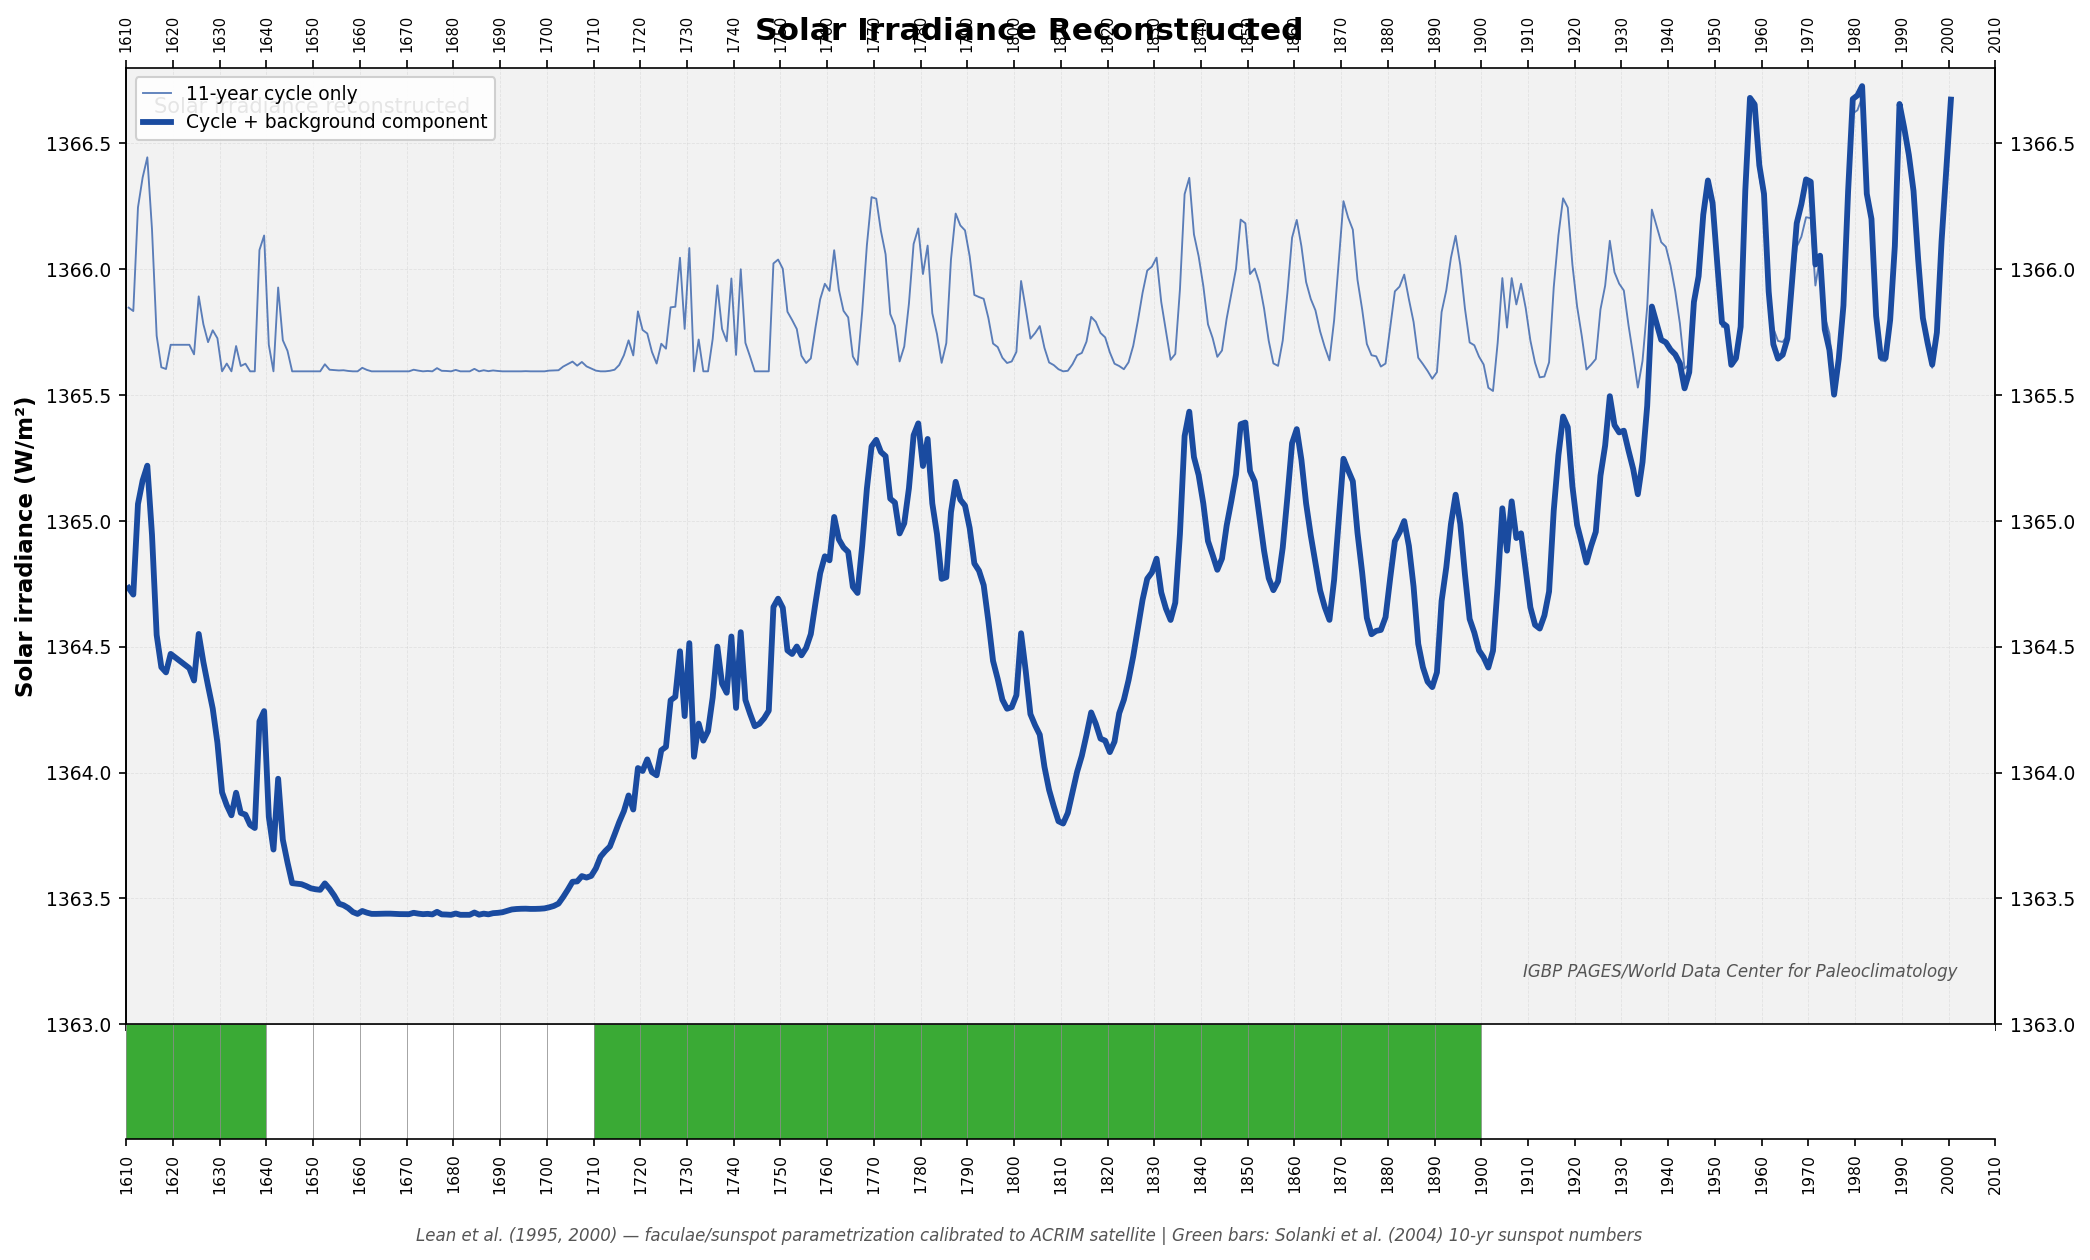
Legacy reconstructed TSI chart from the existing solar reconstruction page.
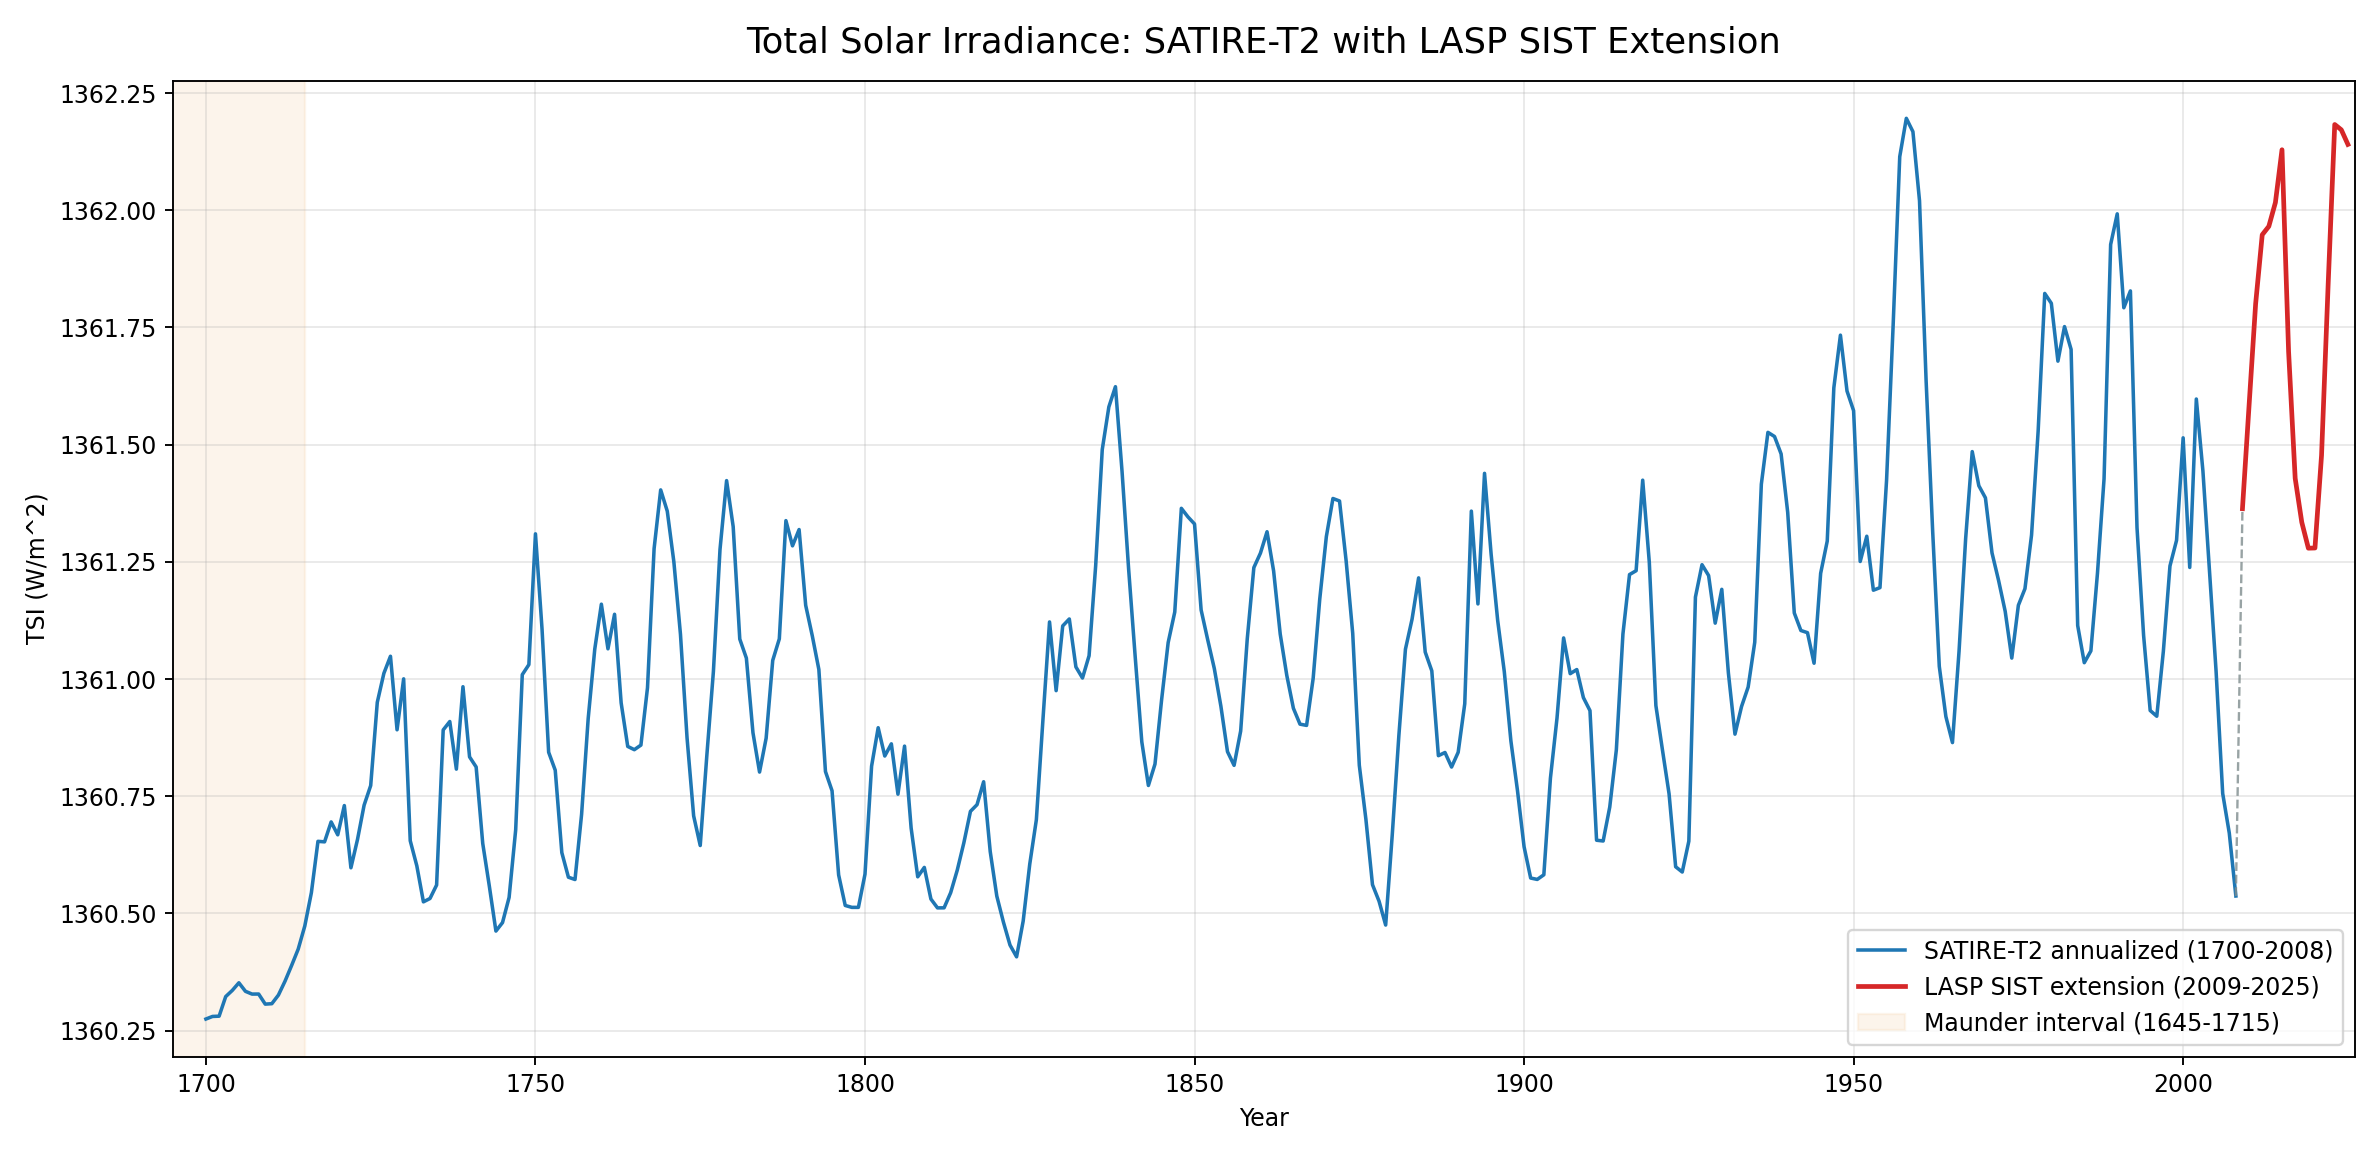
Legend now shows explicit periods: SATIRE-T2 (1700-2008), LASP SIST extension (2009-2025), and Maunder interval (1645-1715).
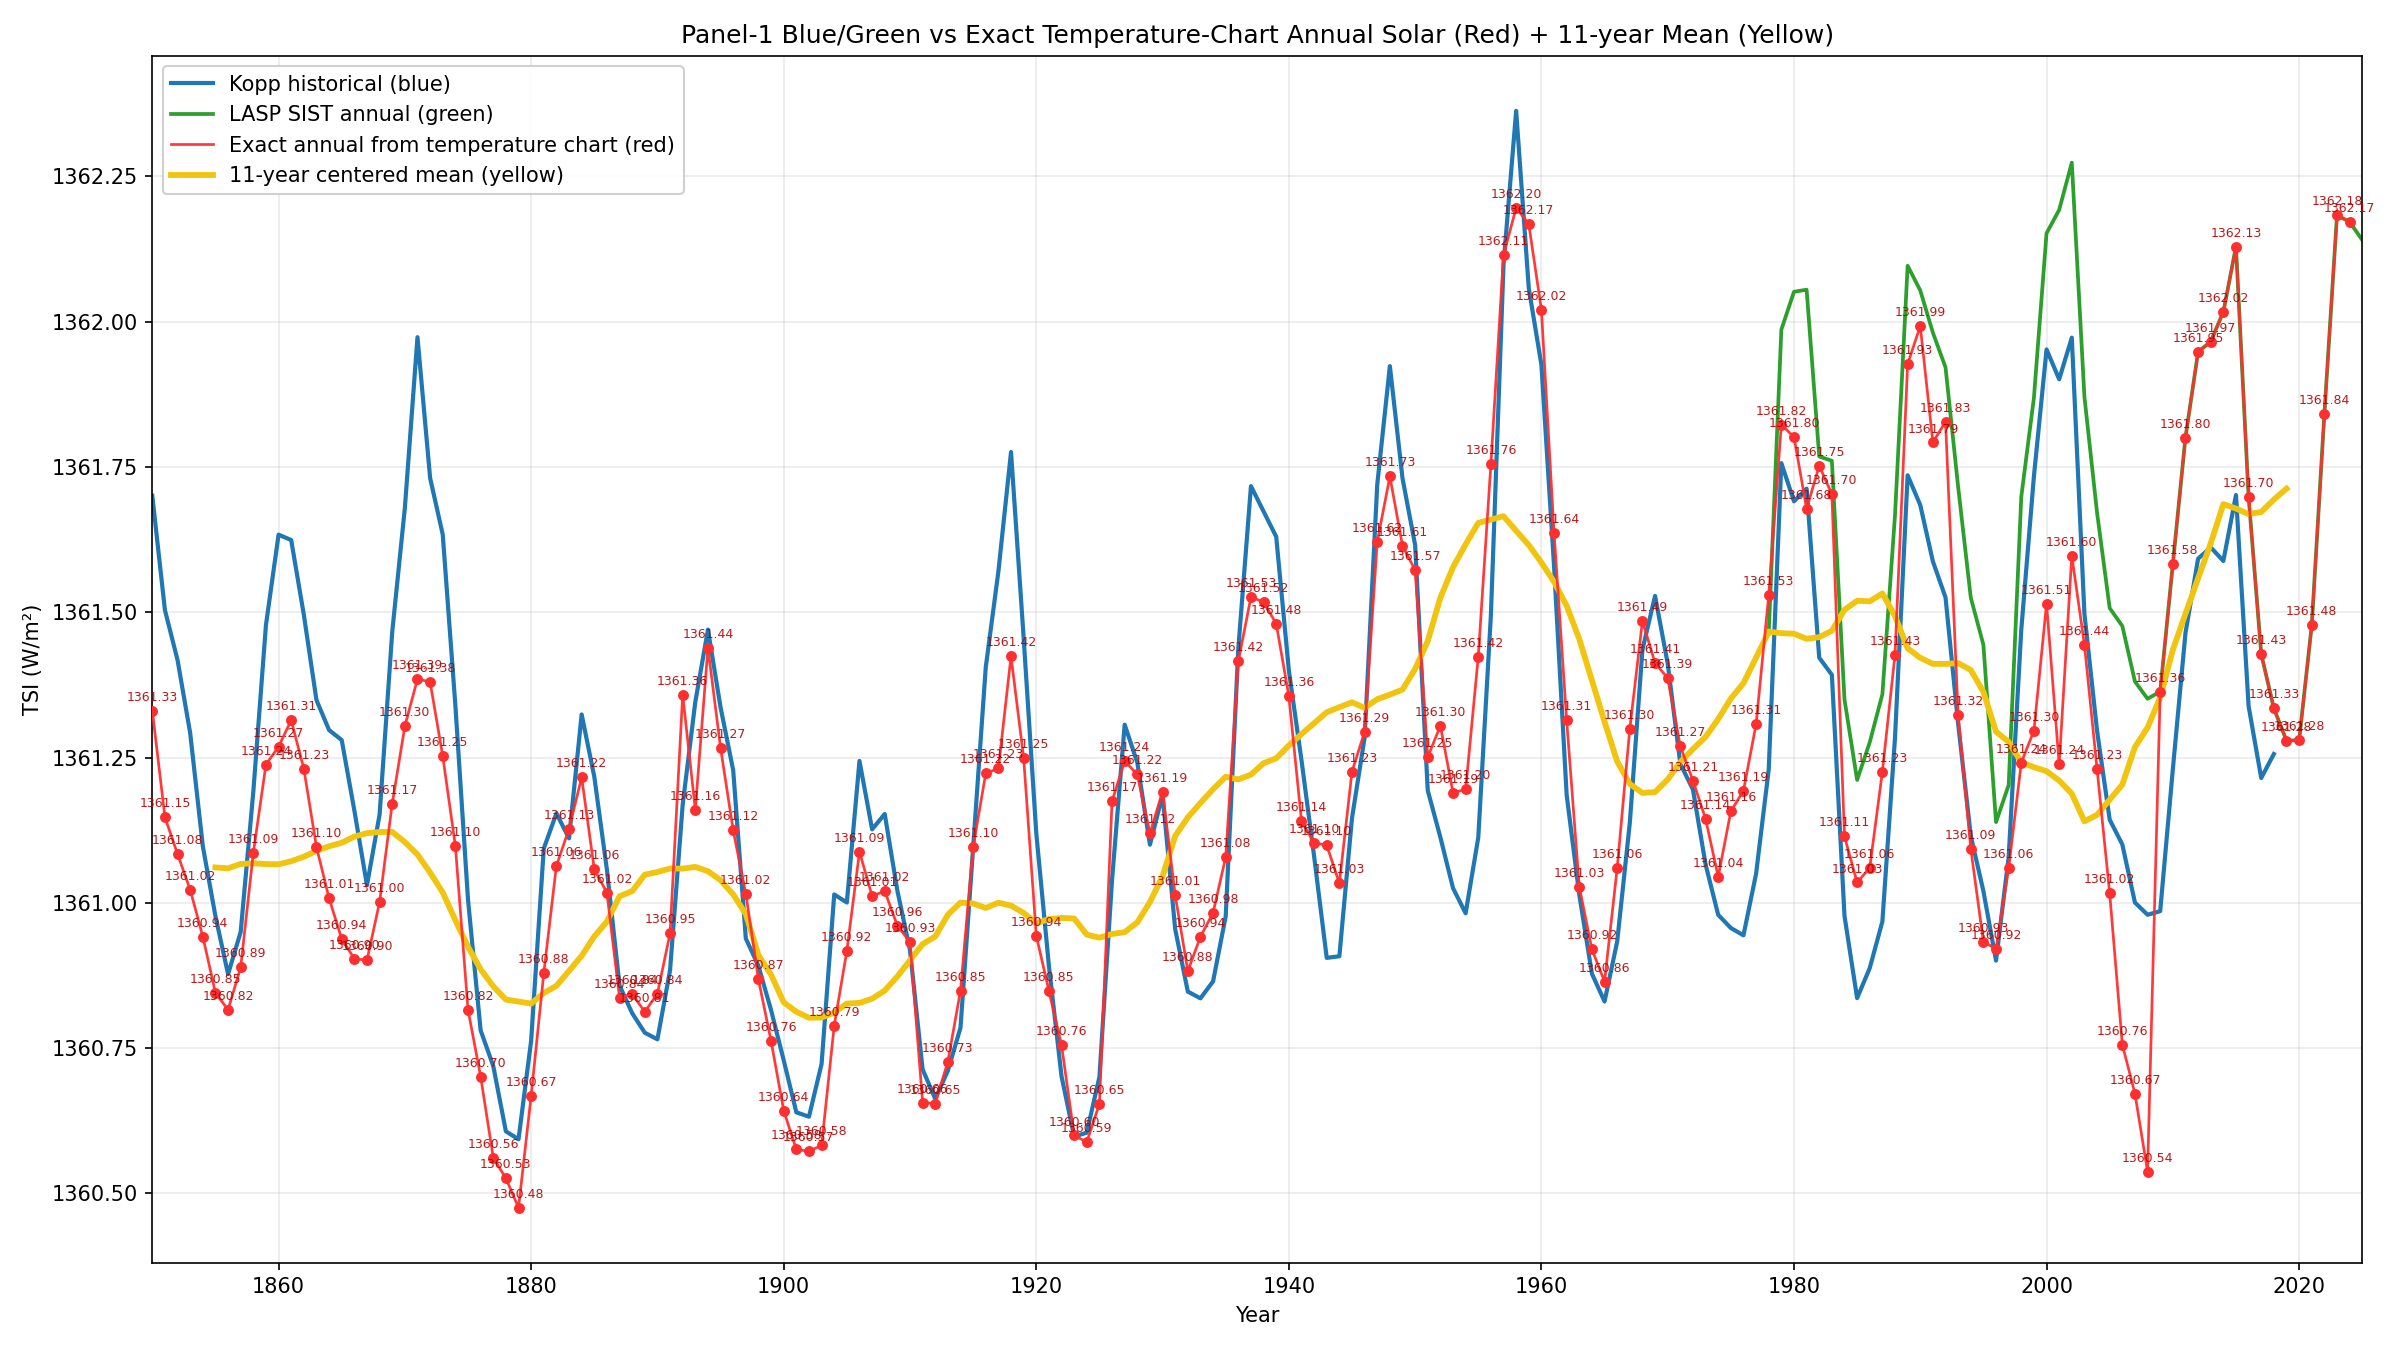
Blue and green are the absolute-series lines from panel 1. This panel is a diagnostic overlay for comparison against the temperature-vs-solar figure, not the restored NASA-style chart itself. Yellow represents the smoothed solar comparison line; treat temperature_vs_solar.png as the reference chart.
satire_t2_tsi.txt (SATIRE-T2 daily) and kopp_tsi_reconstruction.txt (Kopp/LASP annual).