Satellite TSI Sources SEPARATE CHARTS
One page, one chart per dataset, with direct links to each local source file
What is plotted
If you want all of these series on one interactive chart with toggles, range controls, and quick zoom presets, use the new Chart.js interactive TSI comparison page. The earlier Plotly version is still available for comparison.
Each panel below shows TSI from one local dataset so you can compare shape, level, and overlap without stacking everything on one axis. SORCE/TIM, TCTE/TIM, TSIS-1/TIM, and the LASP SIST composite are shown with daily points plus monthly and annual means; the long-run reconstruction panels remain annual-only. The pre-SORCE daily panel uses NOAA's daily climate data record, so it is useful for the 1978-2002 daily view but should not be read as a single raw mission stream.
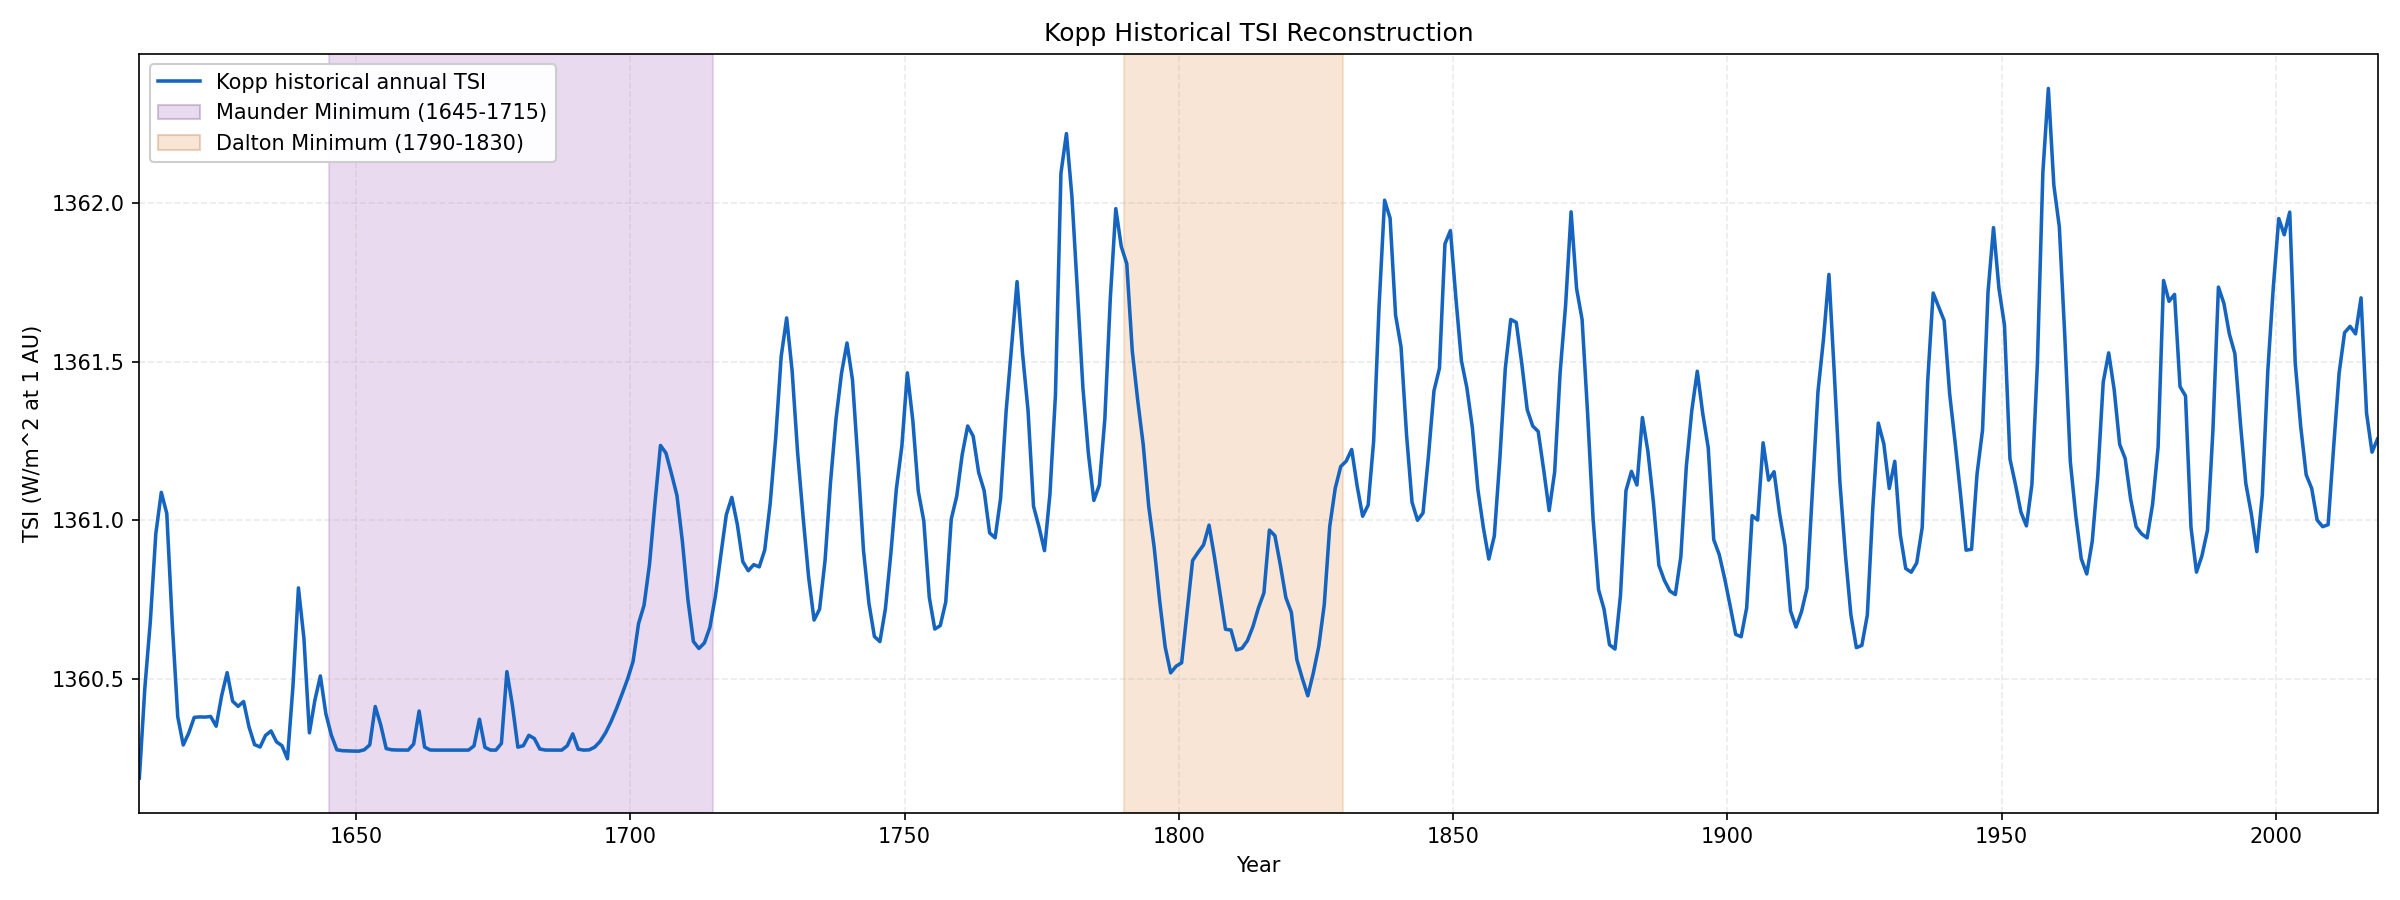
- Kopp historical reconstruction: 1610-2018
- Lean (2015) annual reconstruction: 1610-2014
- Lean (2015) + SIST extension (offset-aligned): 1610-2025
- LASP SIST composite: 1978-2025
- NOAA daily TSI climate data record, full archive: 1874-2025
- NOAA daily TSI climate data record, pre-SORCE view: 1978-2002
- NN-SIM Total Solar Irradiance (LISIRD model product): 1978-2019
- SORCE/TIM Total Solar Irradiance (LISIRD daily mission product): 2003-2020
- CTIM Total Solar Irradiance (LISIRD daily mission product): 2022-2023
- ERBS/ERBE native-format Level-2 TSI mission observations: 1984-2003
- ACRIM II/UARS native-format mission observations: 1991-2001
- ACRIM III daily-mean HDF4 mission observations: 2000-2002
- ACRIM III shutter-cycle HDF4 mission observations (daily reduced): 2000-2013
- SOHO/VIRGO daily mission observations (v1.2 file): 1996-1998
- SOHO/VIRGO V8 full mission daily (NASA SOHO archive, fused new SI scale): 1996-2021
- ACRIM I / Solar Maximum Mission (SMM) daily observations (NOAA NGDC SMM.PLT, old SMM scale): 1980-1989
- PICARD/PREMOS N2A mission observations (FITS granules, daily reduced): 2010-2014
- PICARD/SOVAP TSI composite (CDS VizieR VI/152, 6-hourly averaged to daily): 2010-2014
- NIMBUS-7 ERB Ch10C raw stream (drop-in pipeline ready, more mission slots can be added later)
- SORCE/TIM daily plus monthly and annual means: 2003-2020
- TCTE/TIM daily plus monthly and annual means: 2013-2019
- TSIS-1/TIM daily plus monthly and annual means: 2018-2026
- SORCE/TIM versioned GES DISC archive (SOR3TSID v19), with LISIRD cross-check: 2003-2020
- TCTE/TIM versioned GES DISC archive (TCTE3TSID v04), with LISIRD cross-check: 2013-2019
- TSIS-1/TIM versioned GES DISC archive (TSIS_TSI_L3_24HR v05), with LISIRD cross-check: 2018-2026
- Maunder Minimum: approximately 1645-1715
- Dalton Minimum: approximately 1790-1830
Kopp Historical Reconstruction
Lean (2015) Reconstruction
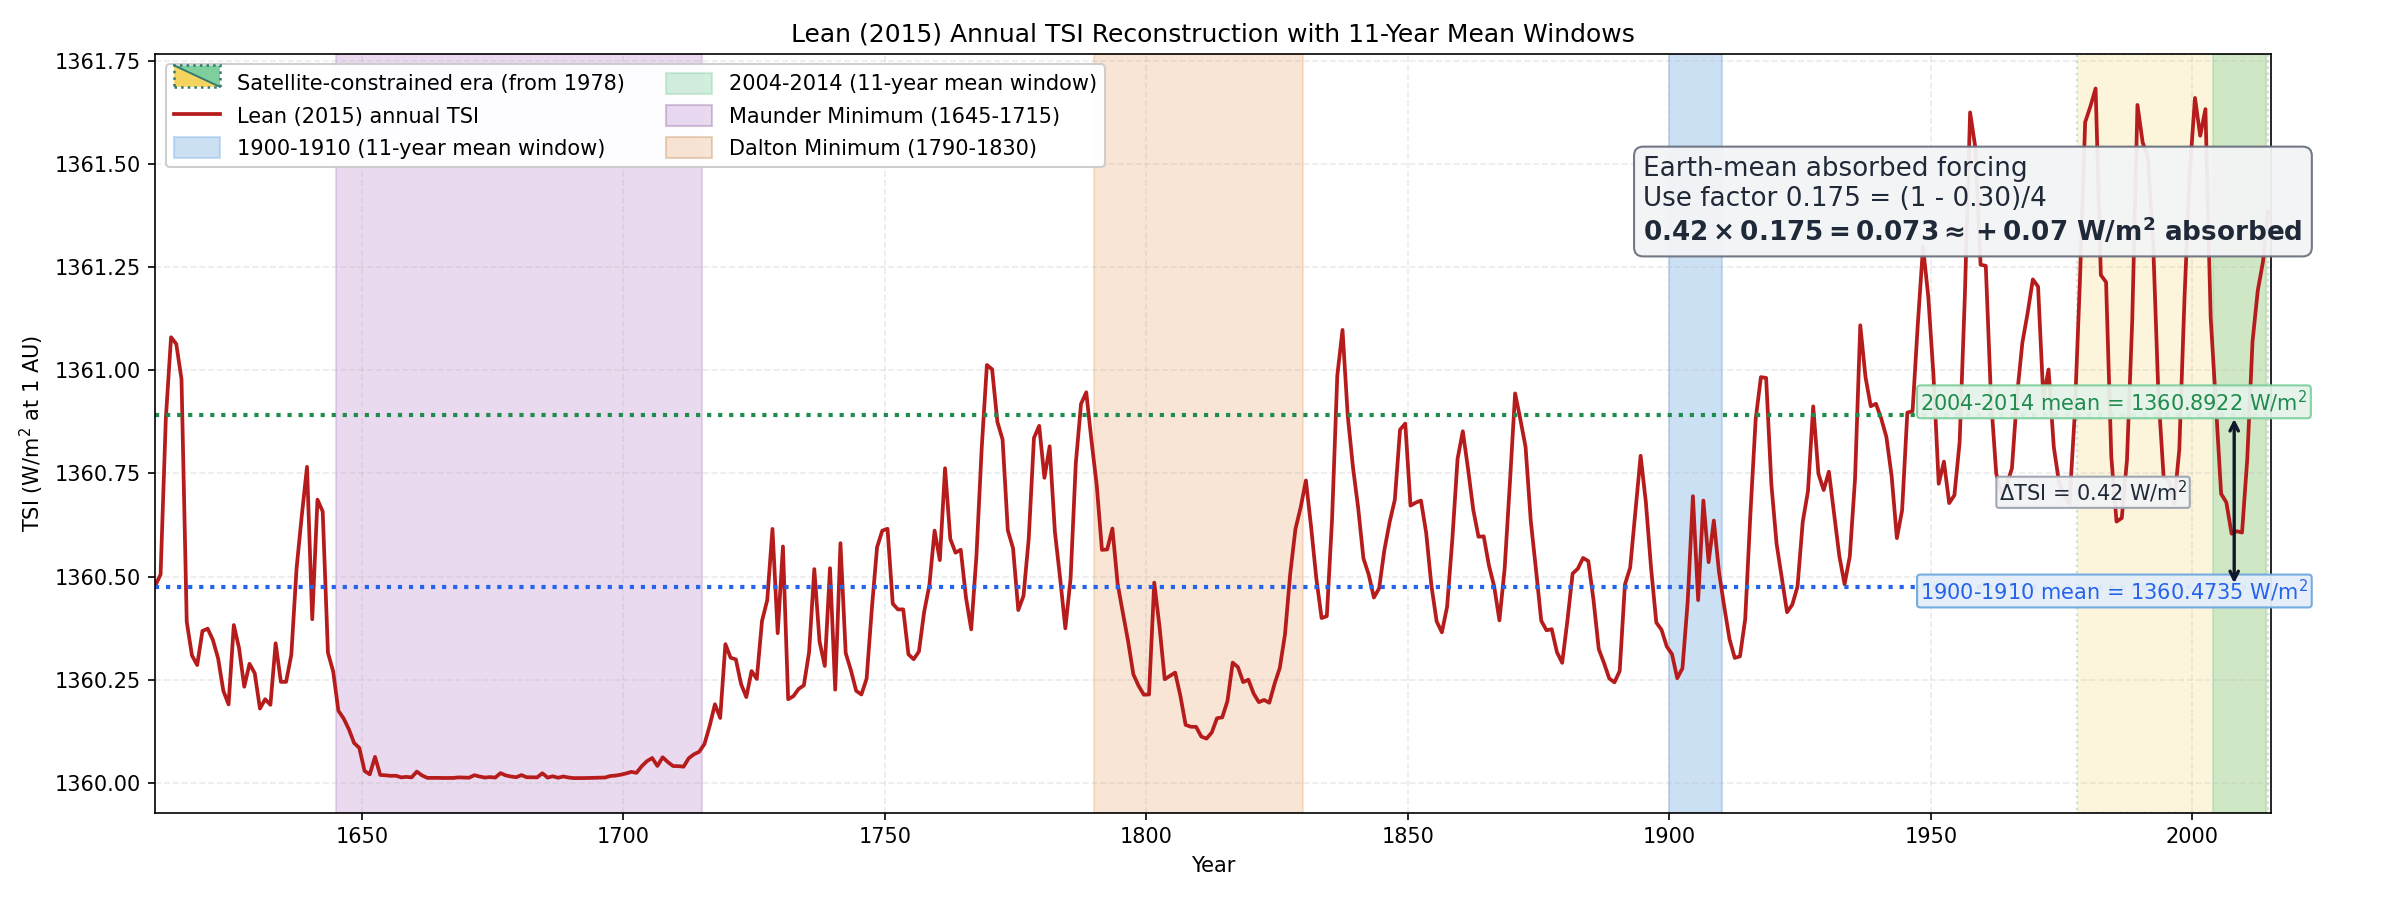
Yellow shading marks the satellite-constrained era (1978 onward). Blue/green windows are 11-year means (1900-1910 and 2004-2014) to reduce solar-cycle phase bias. Dotted lines mark those means; the arrow shows ΔTSI ≈ +0.42 W/m².
Key conversion in plain terms: Earth does not absorb all incoming solar change. Using ΔF = ΔTSI × (1-α)/4 with α = 0.30 gives a factor of 0.175, so 0.42 × 0.175 = 0.073 ≈ +0.07 W/m² absorbed.
In NASA GISS modelforce (Fe_H11_1880-2011), 2011 solar forcing is +0.189 W/m², while well-mixed greenhouse gases are +3.026 W/m² (about 16 times larger), or +3.305 W/m² including ozone + stratospheric water vapour (about 17.5 times larger).
Lean (2015) with Post-2014 Extension (SIST-aligned)
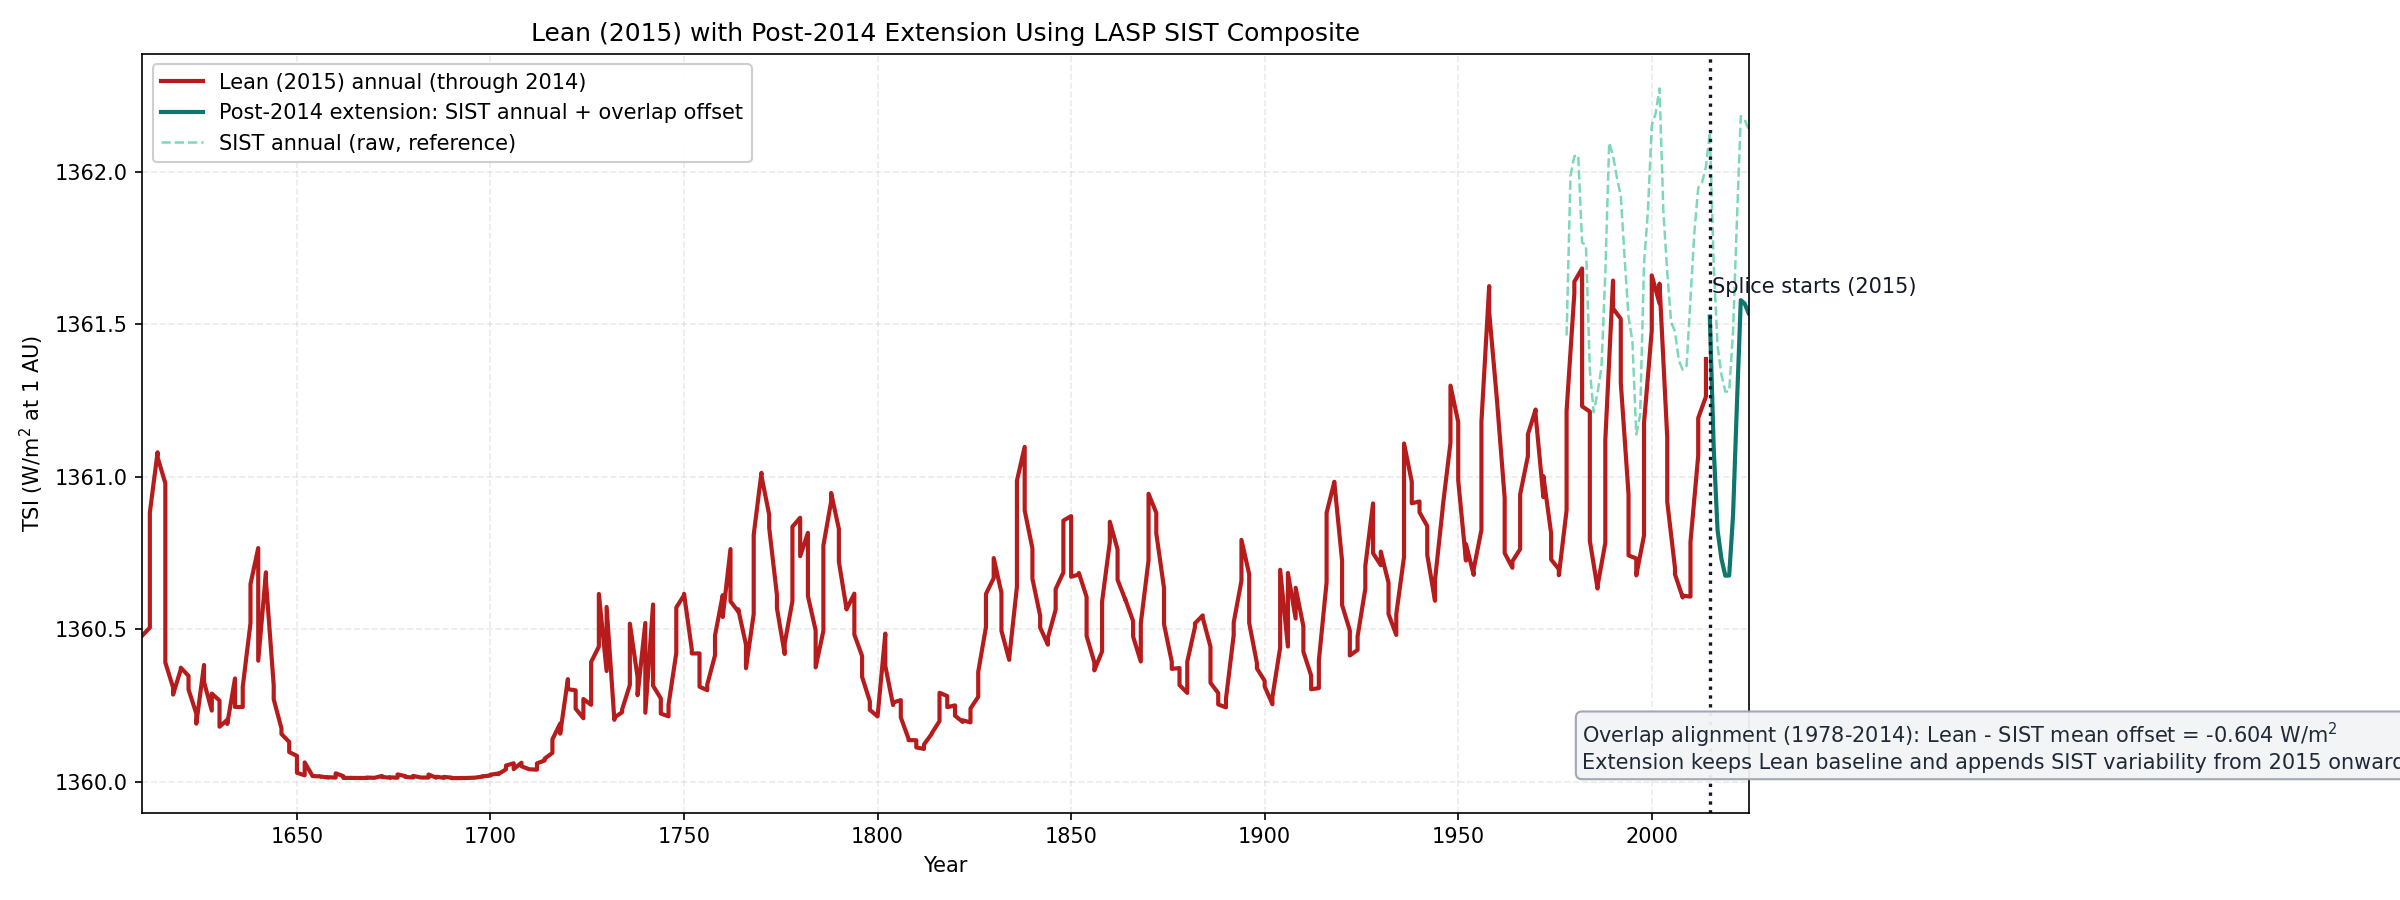
Solid red: Lean (2015) through 2014. Solid teal: post-2014 extension using SIST annual plus overlap offset. Dashed green: raw SIST annual reference. Dotted vertical marker shows 2015 splice point.
LASP SIST Composite
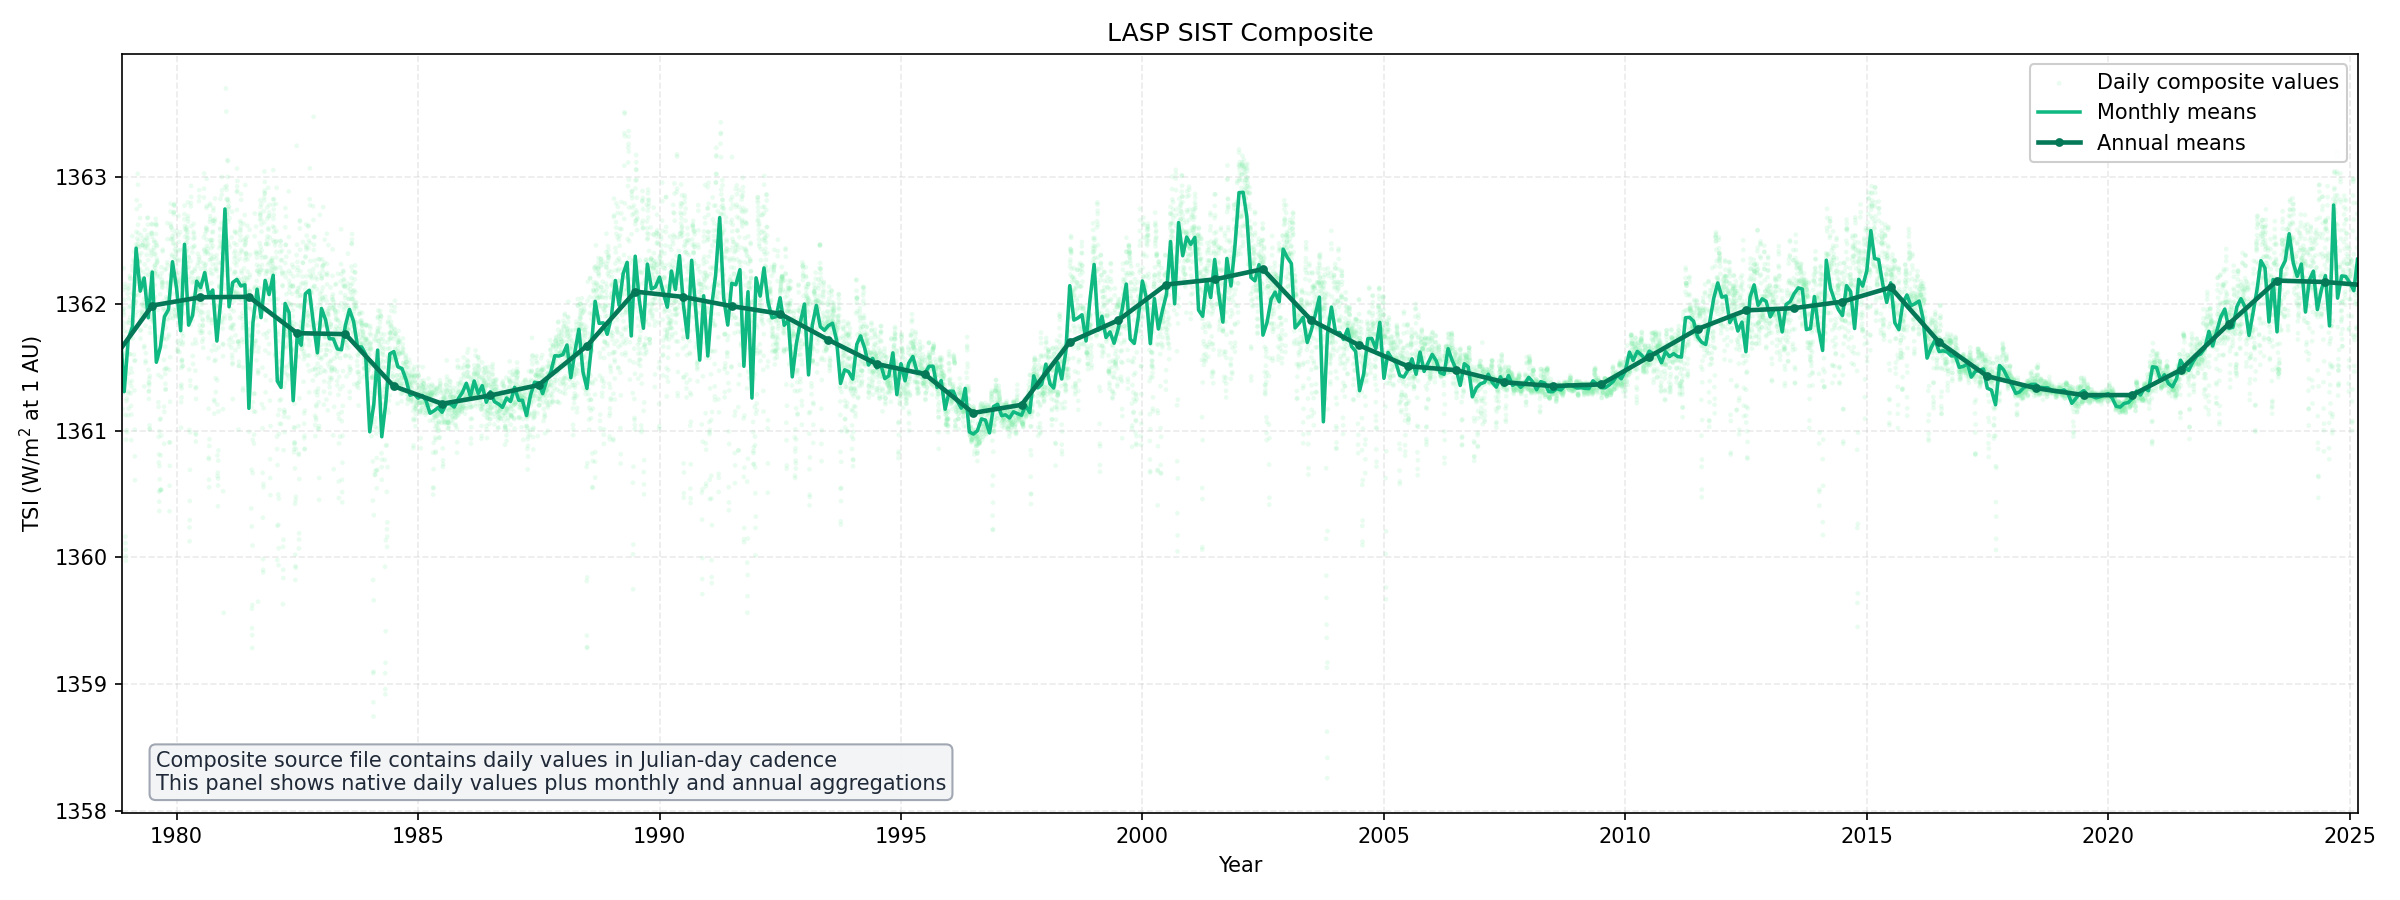
Light points: daily composite values. Green line: monthly means. Dark green line/markers: annual means.
NOAA Daily TSI CDR Full Archive
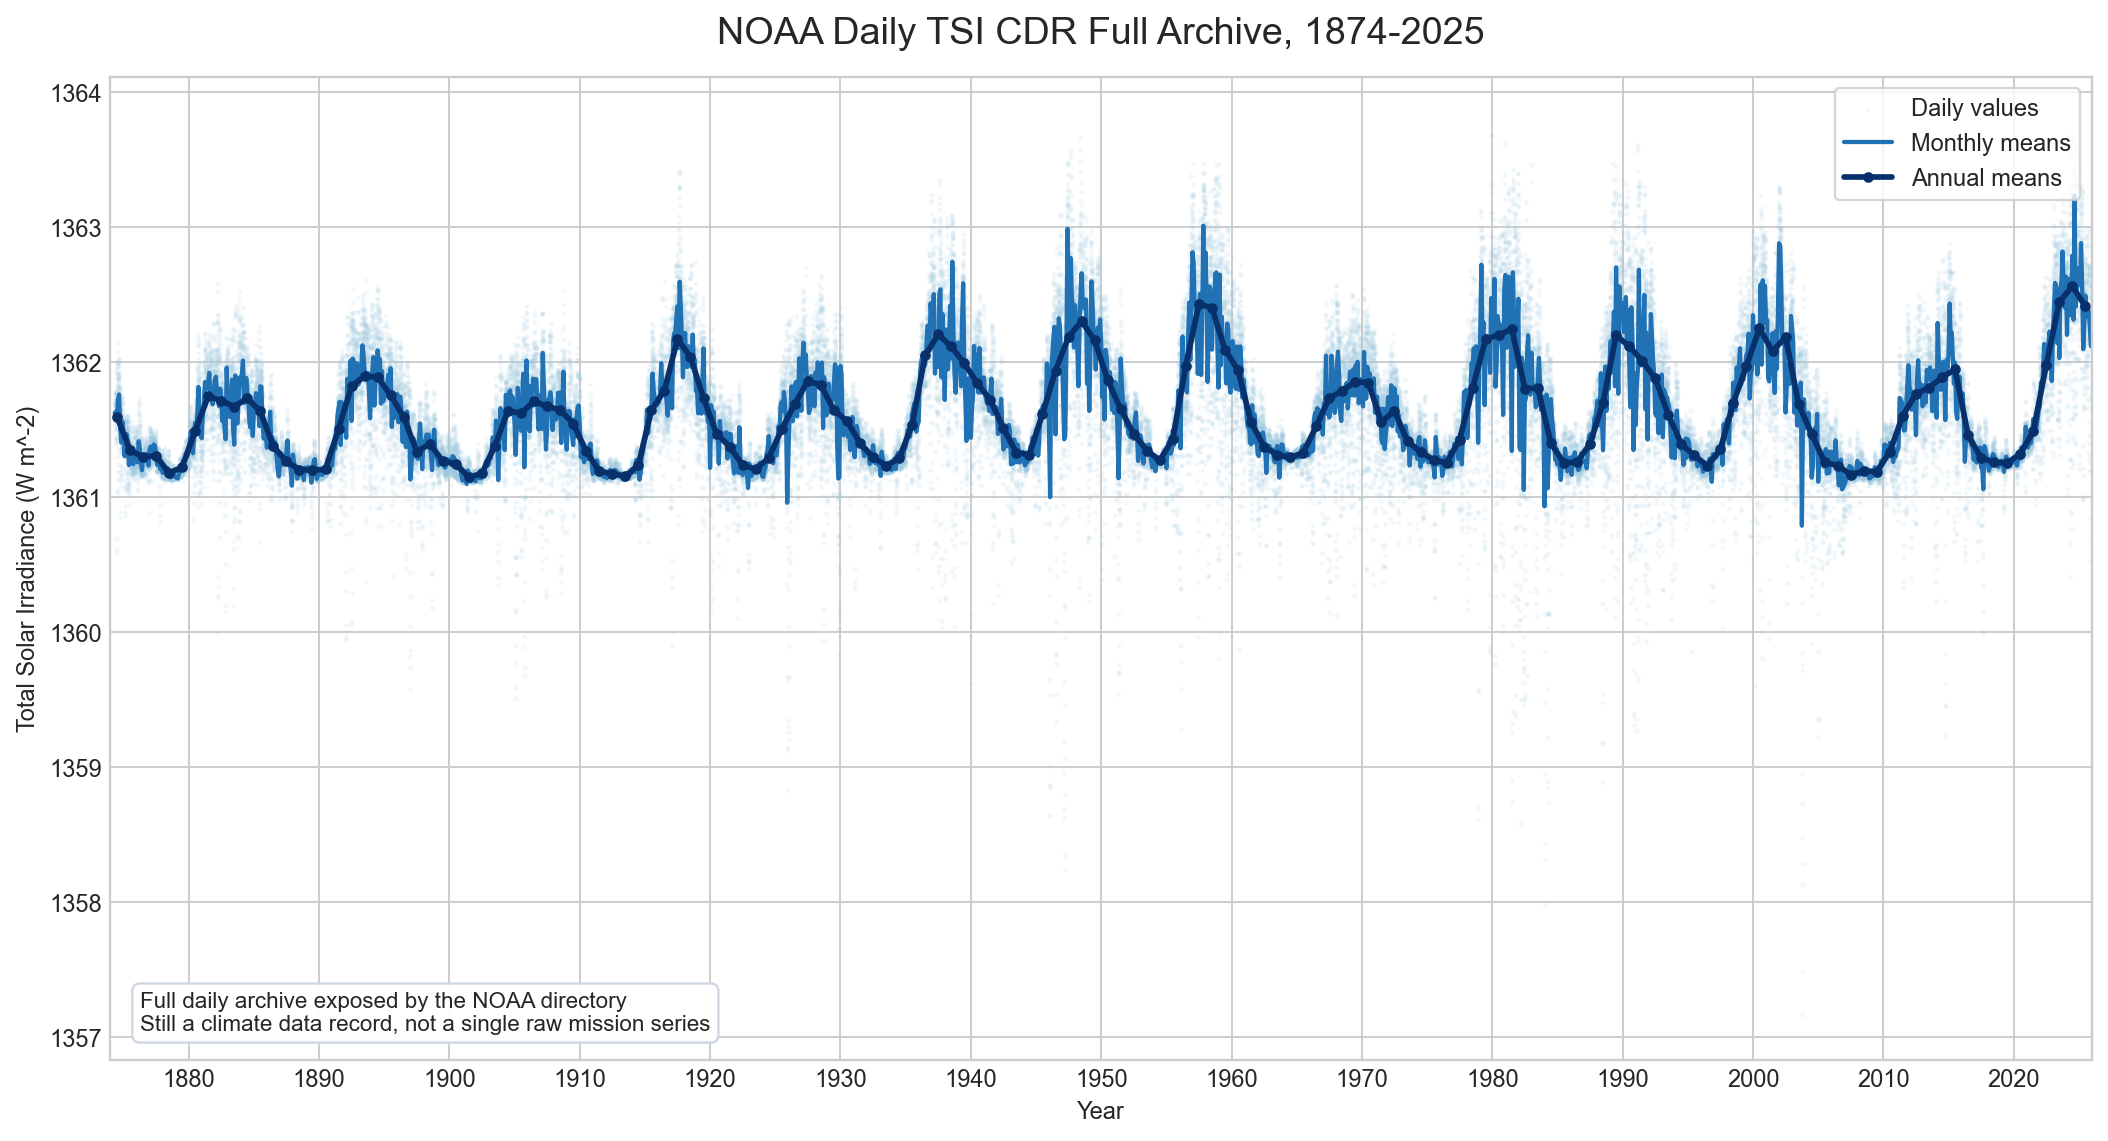
Light points: daily values. Blue line: monthly means. Dark line/markers: annual means. This is the full archive view for context across the whole NOAA daily record.
Pre-SORCE Daily View (NOAA TSI CDR)
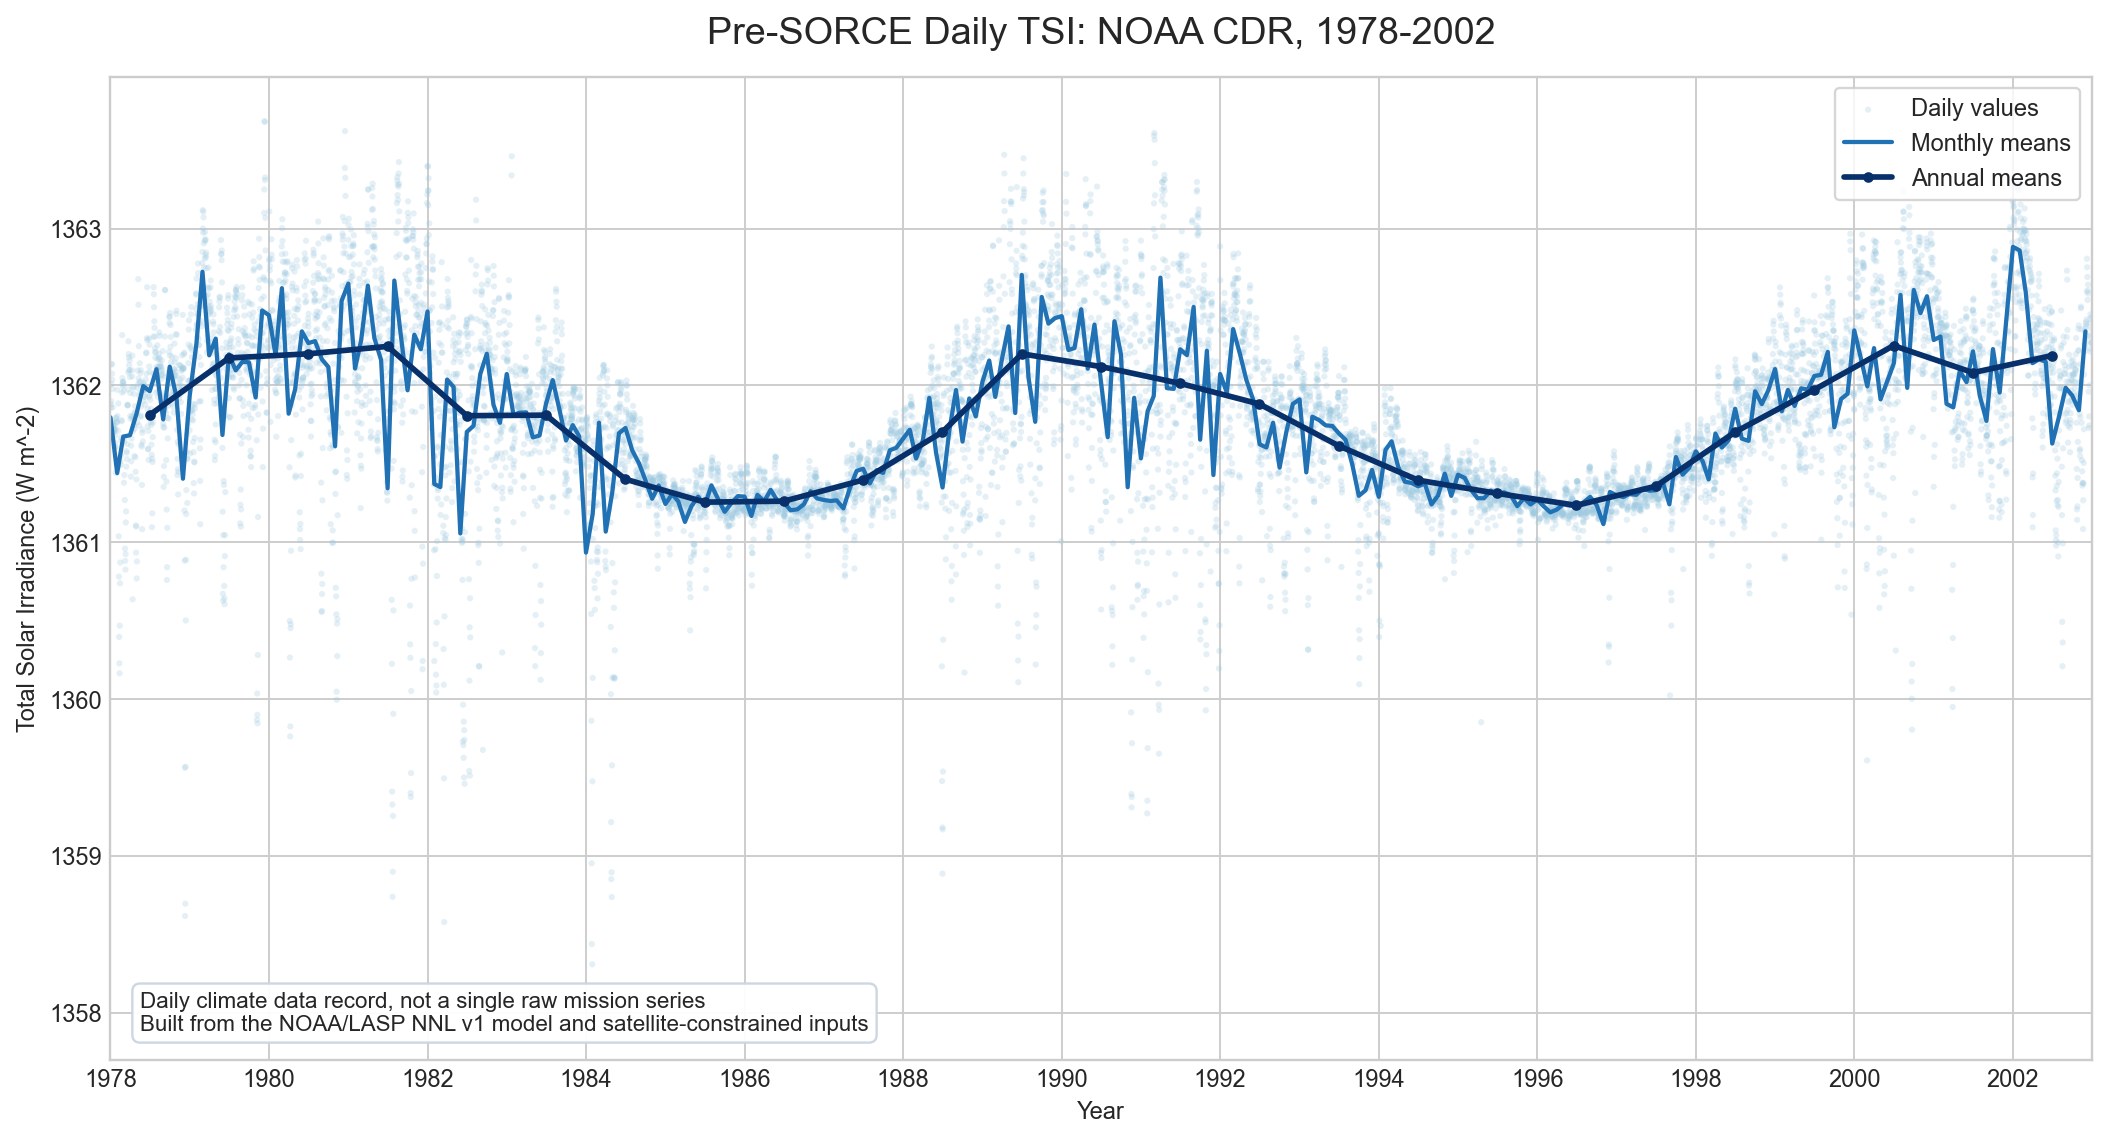
Light points: daily values. Blue line: monthly means. Dark line/markers: annual means. Use this as the accessible pre-SORCE daily comparison panel, but keep its composite/modelled provenance distinct from direct mission products.
NIMBUS-7 ERB Ch10C Raw Inputs Only
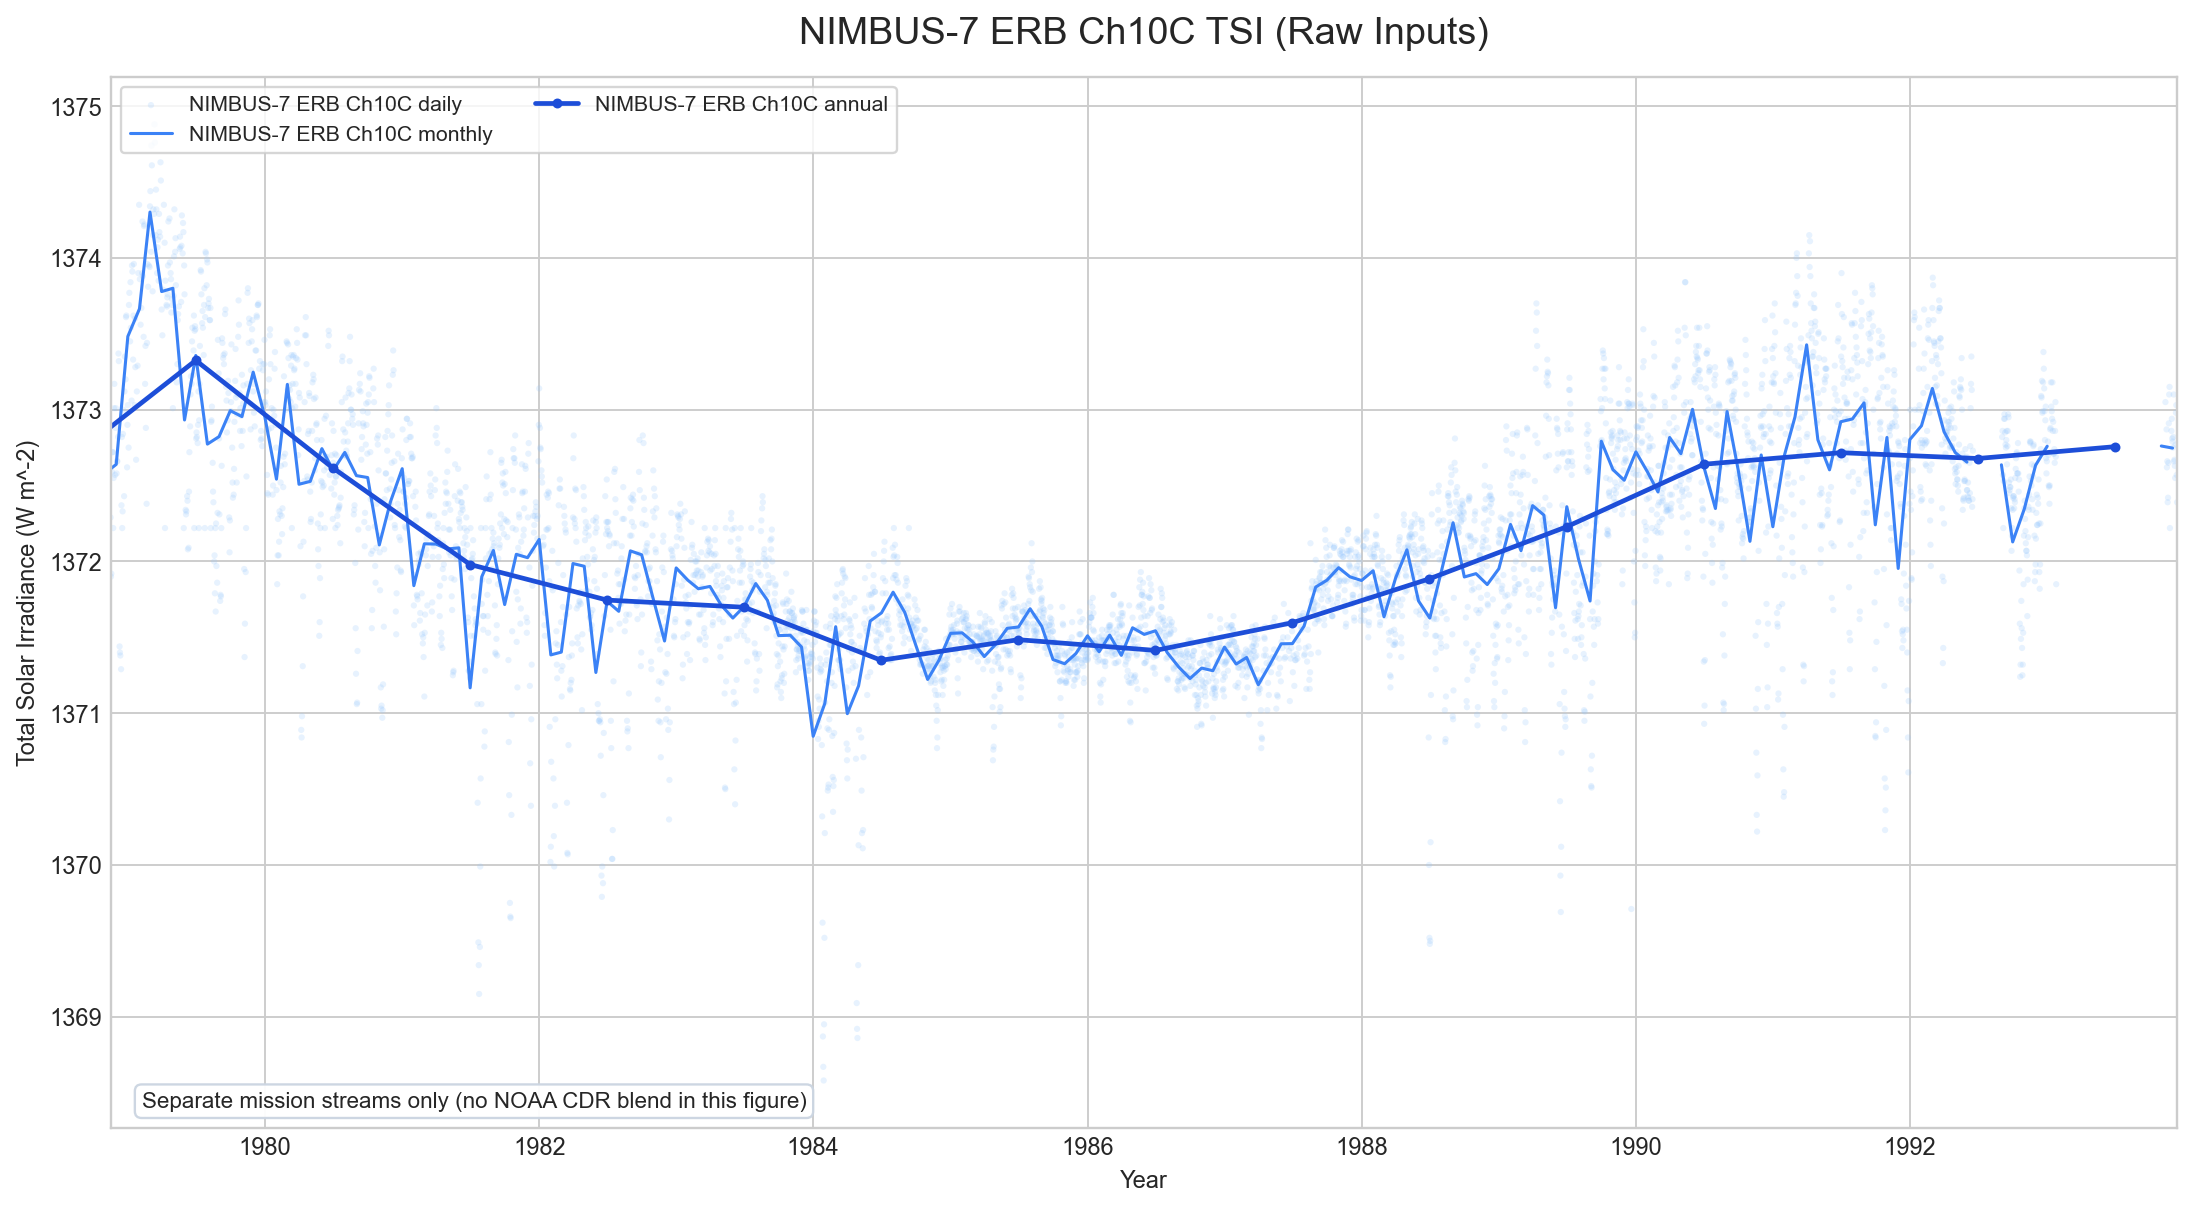
Light points: daily values from the raw NIMBUS-7 ERB Ch10C TSI file. Blue line: monthly means. Dark line/markers: annual means. This panel is separate from NOAA CDR so the raw mission stream stays unblended.
NN-SIM Total Solar Irradiance (LISIRD)
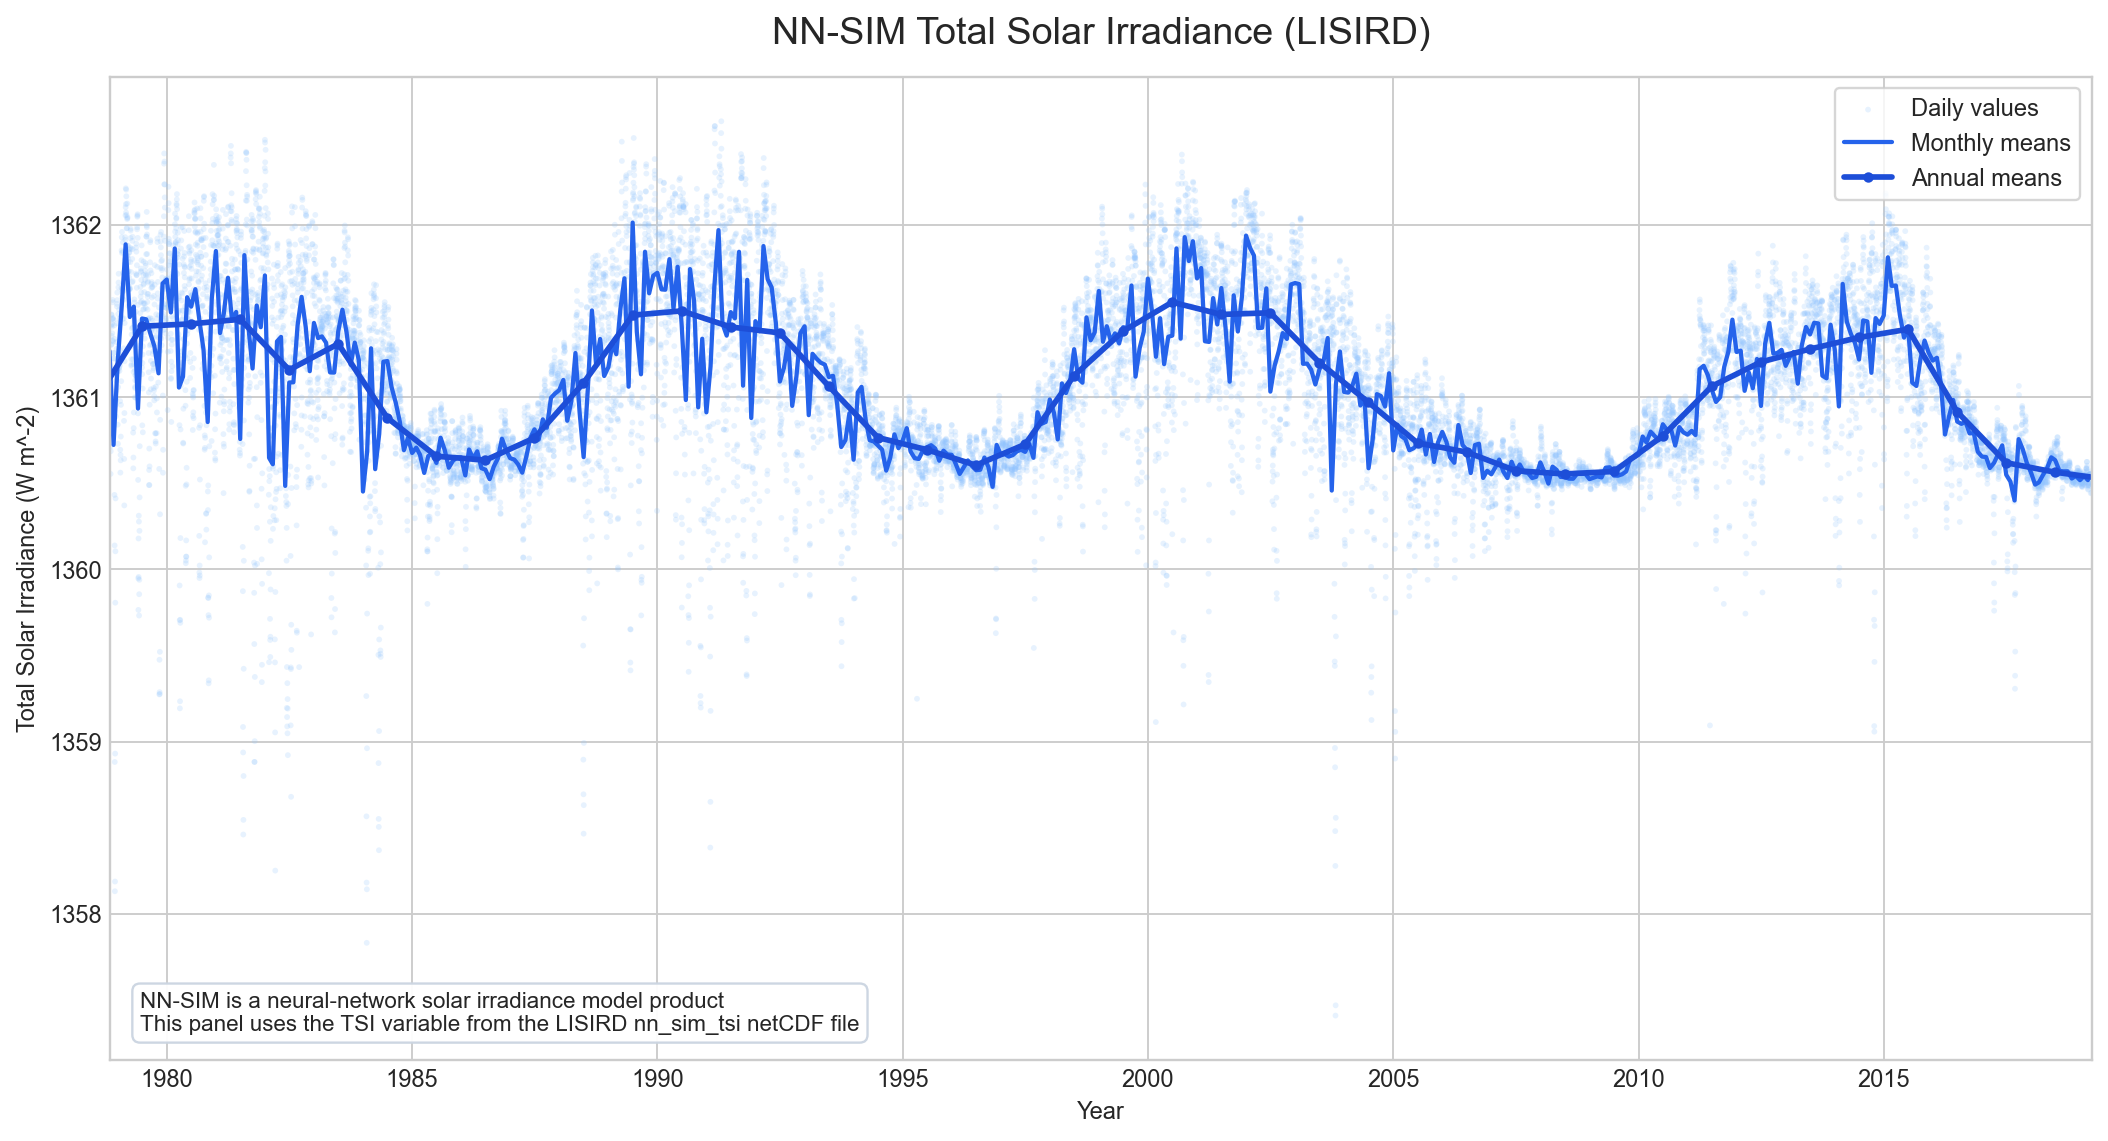
Light points: daily TSI values from the netCDF file. Blue line: monthly means. Dark line/markers: annual means. Date span shown: 1978-11-08 to 2019-03-31.
SORCE/TIM Total Solar Irradiance (LISIRD Daily Product)
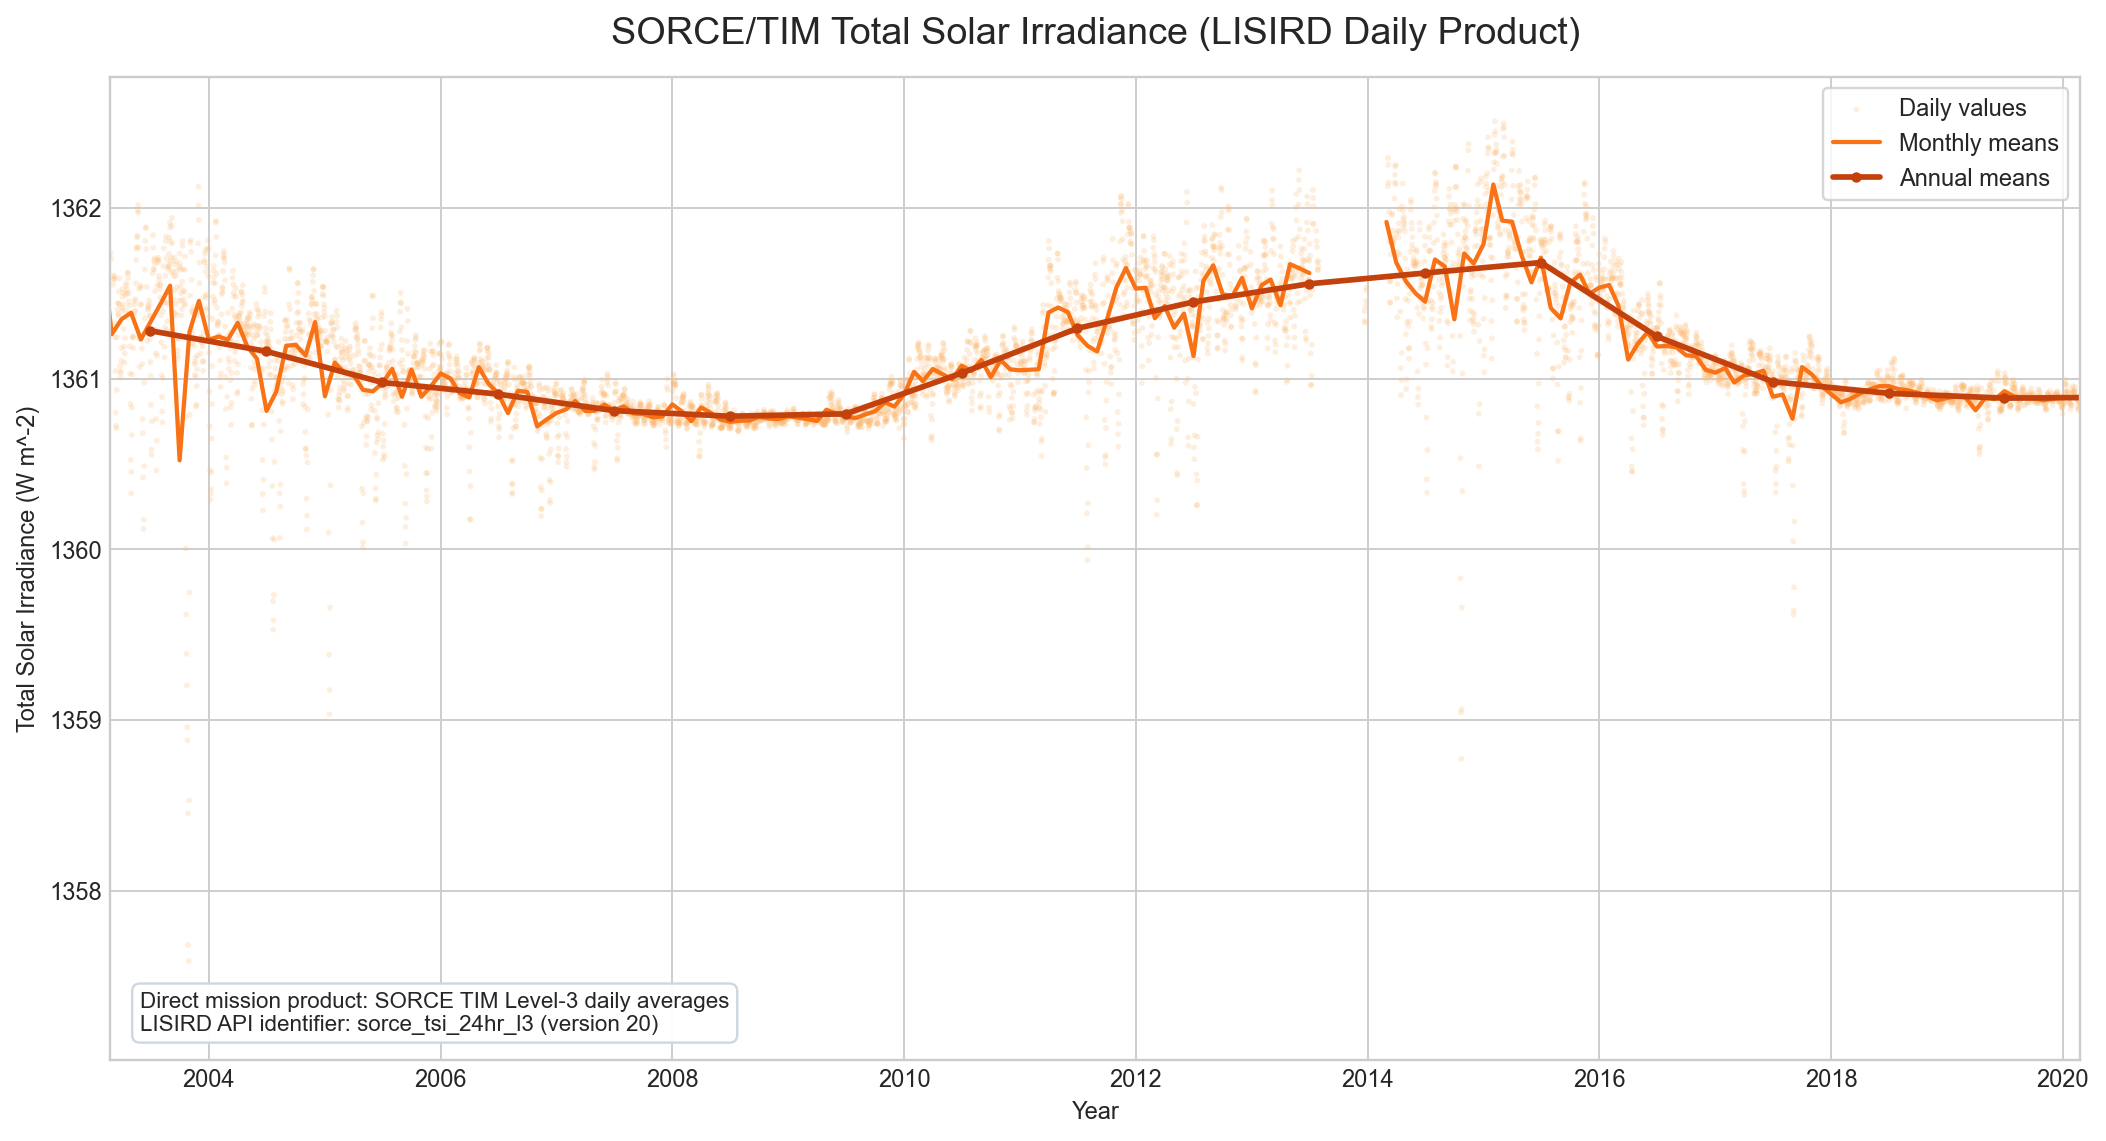
Light points: daily mission values. Orange line: monthly means. Dark line/markers: annual means. Date span shown: 2003-02-25 to 2020-02-25.
CTIM Total Solar Irradiance (LISIRD Daily Product)
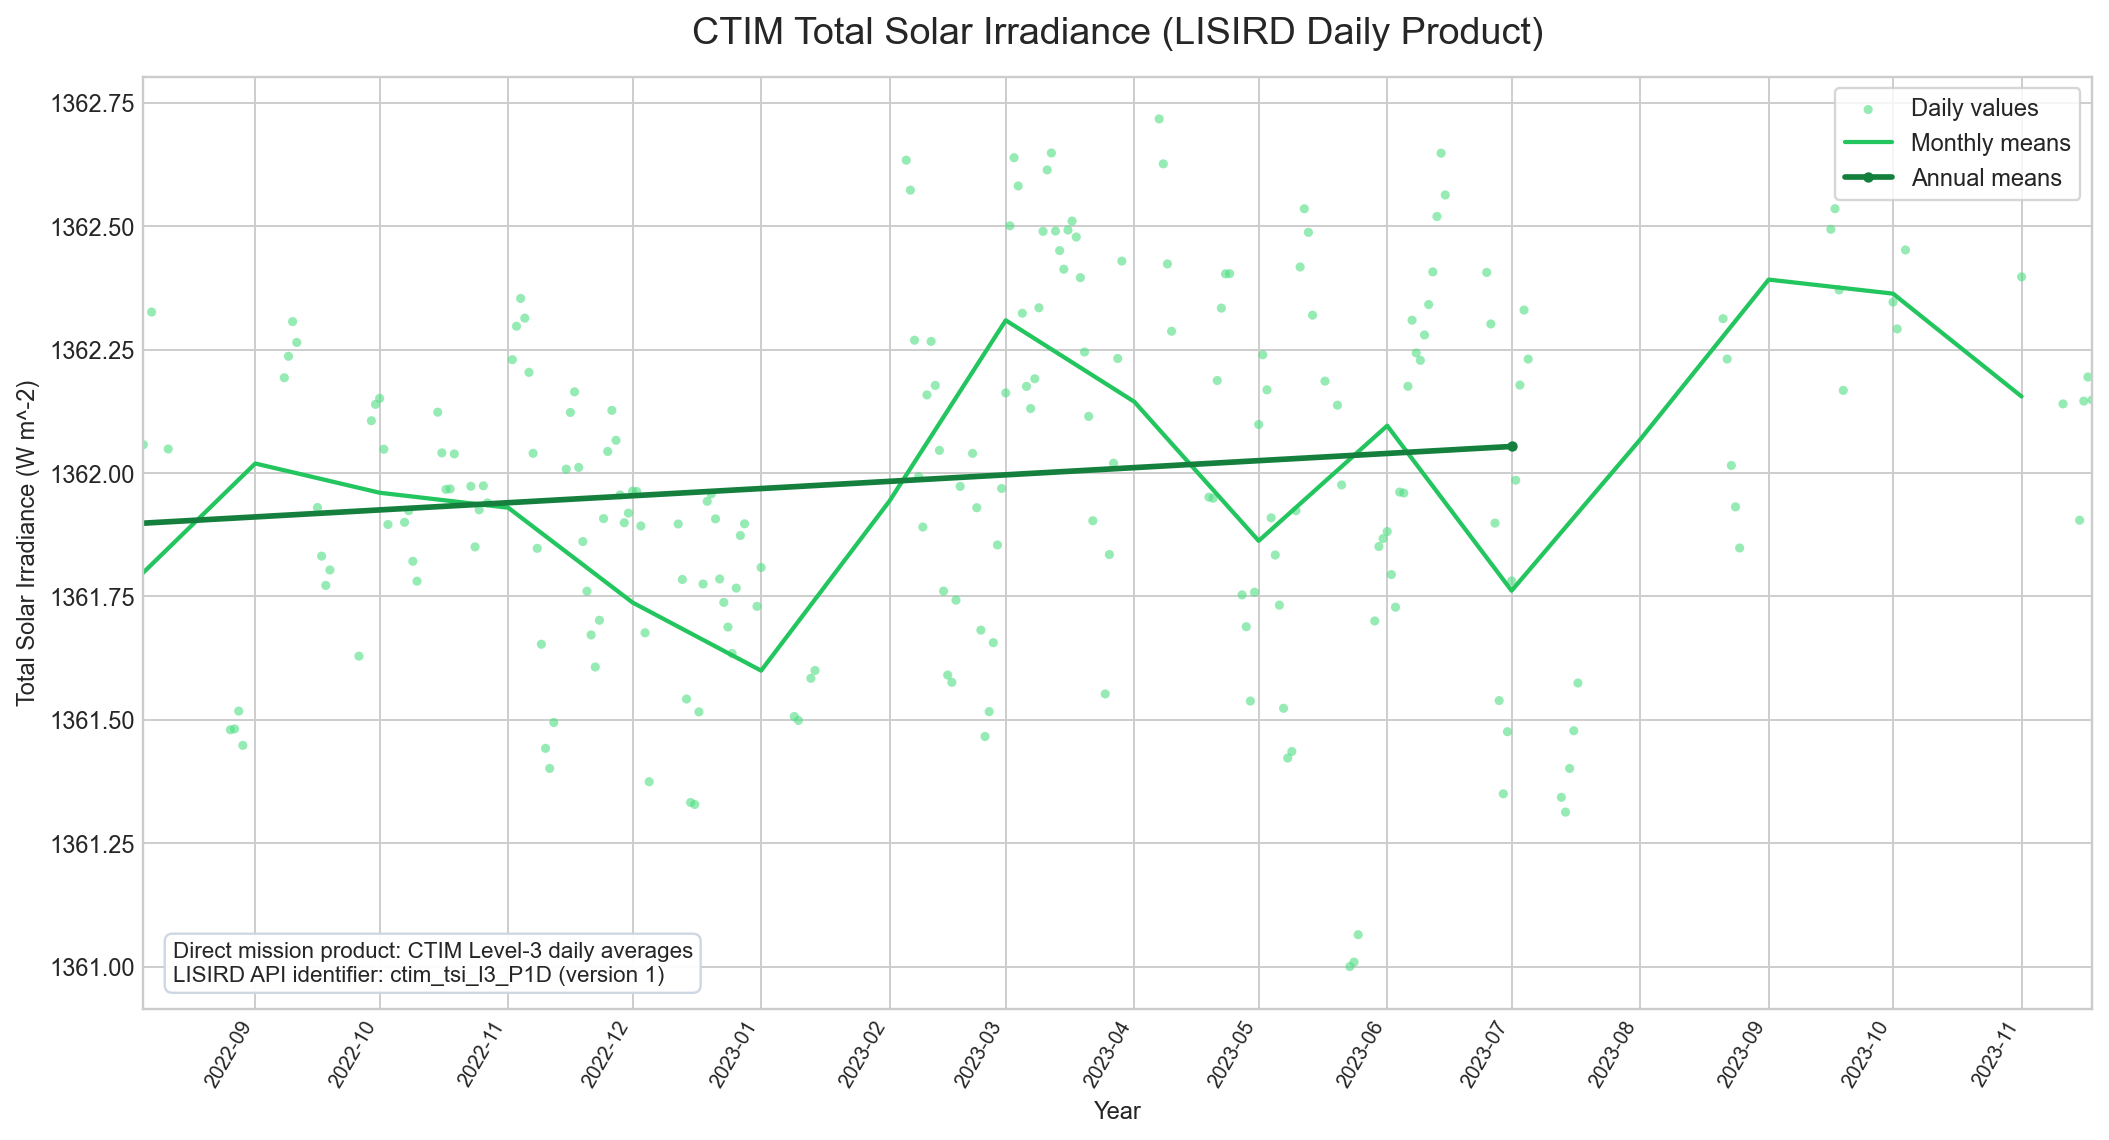
Light points: daily mission values. Green line: monthly means. Dark green line/markers: annual means. Date span shown: 2022-08-05 to 2023-11-18.
ERBS/ERBE TSI Native Format (ASDC Level-2 Mission Data)
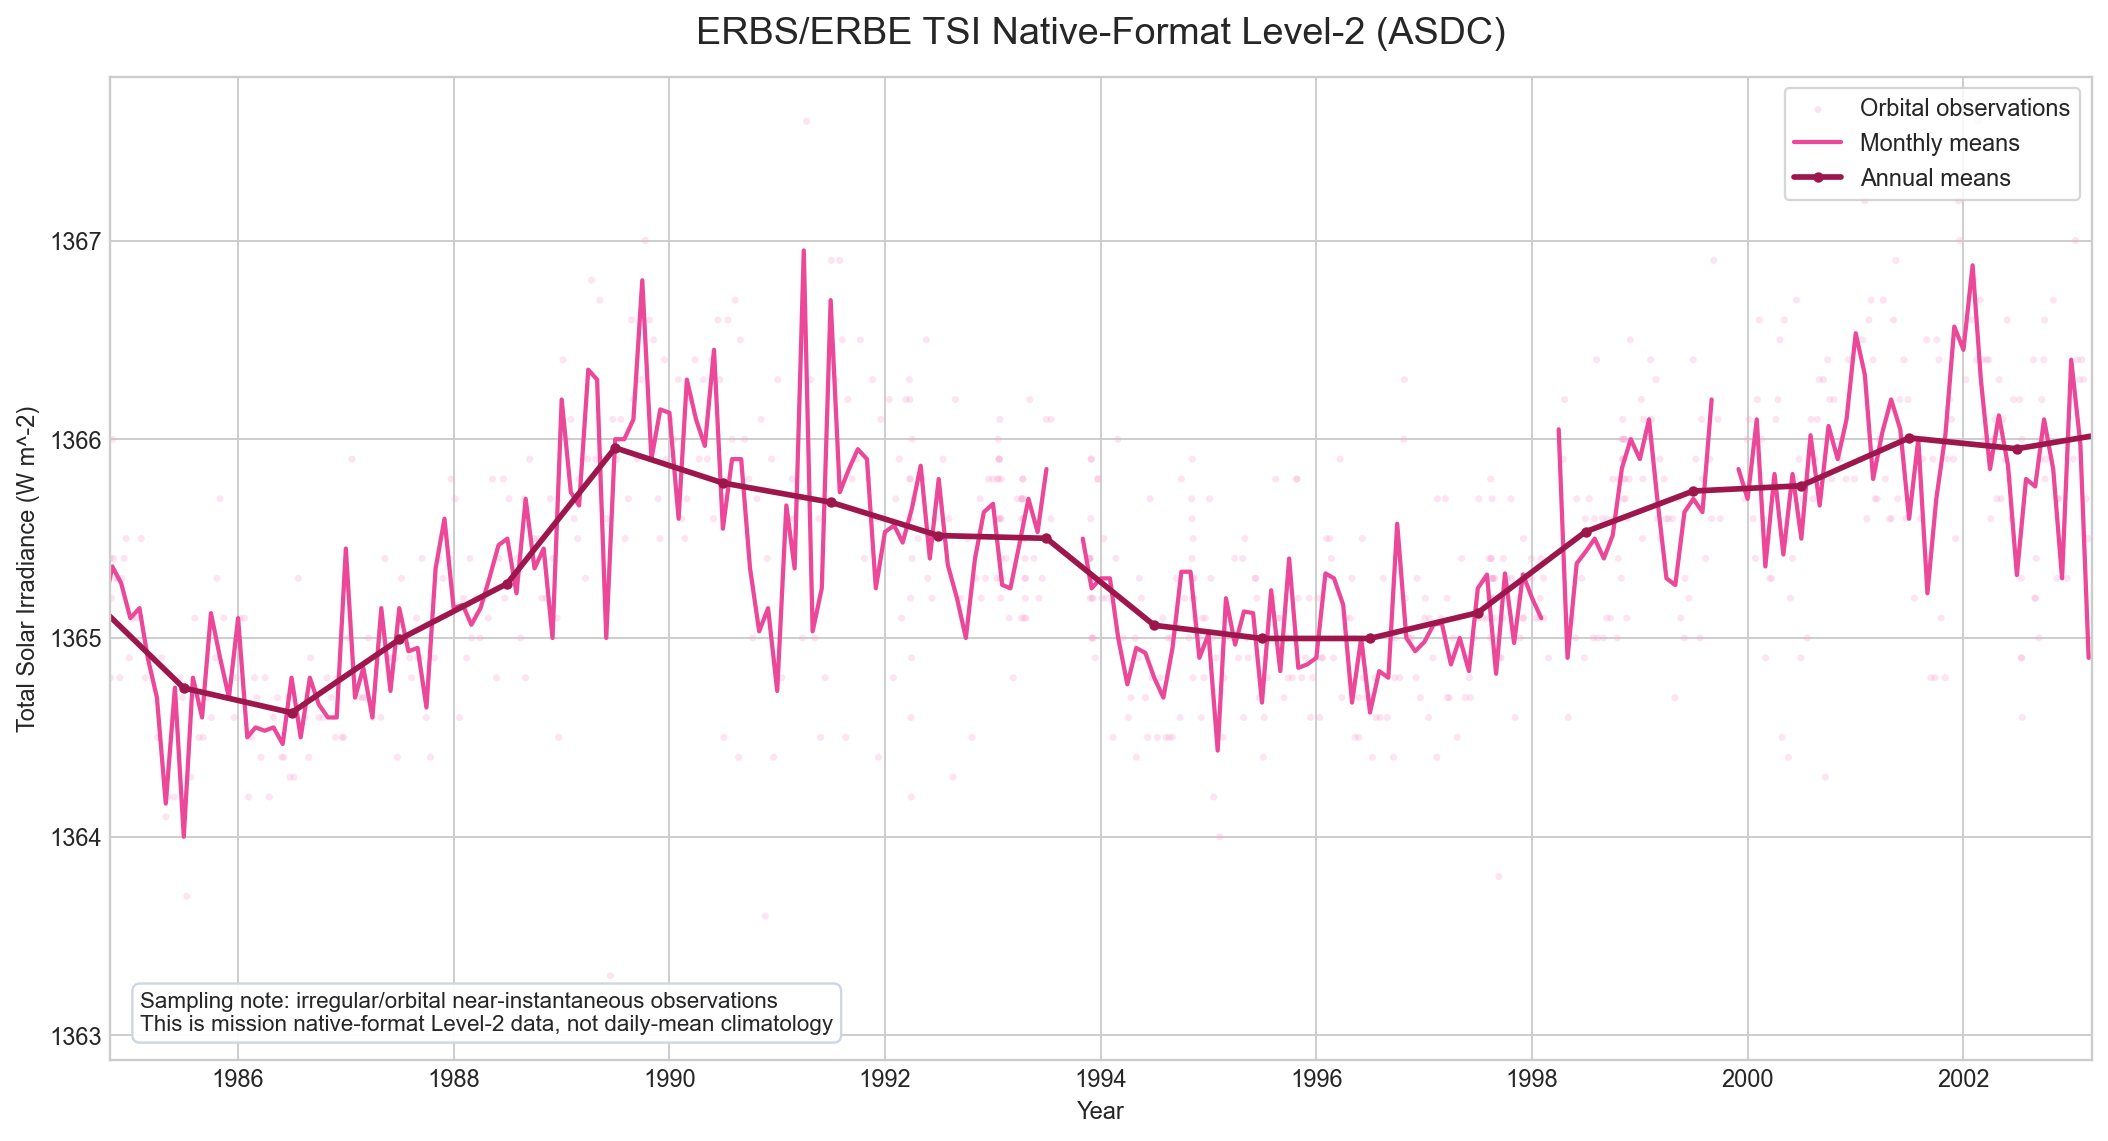
Light points: individual orbital/near-instantaneous mission observations. Pink line: monthly means. Dark line/markers: annual means. Date span shown: 1984-10-25 to 2003-03-12.
ACRIM II/UARS TSI Native Format (ASDC Mission Data)
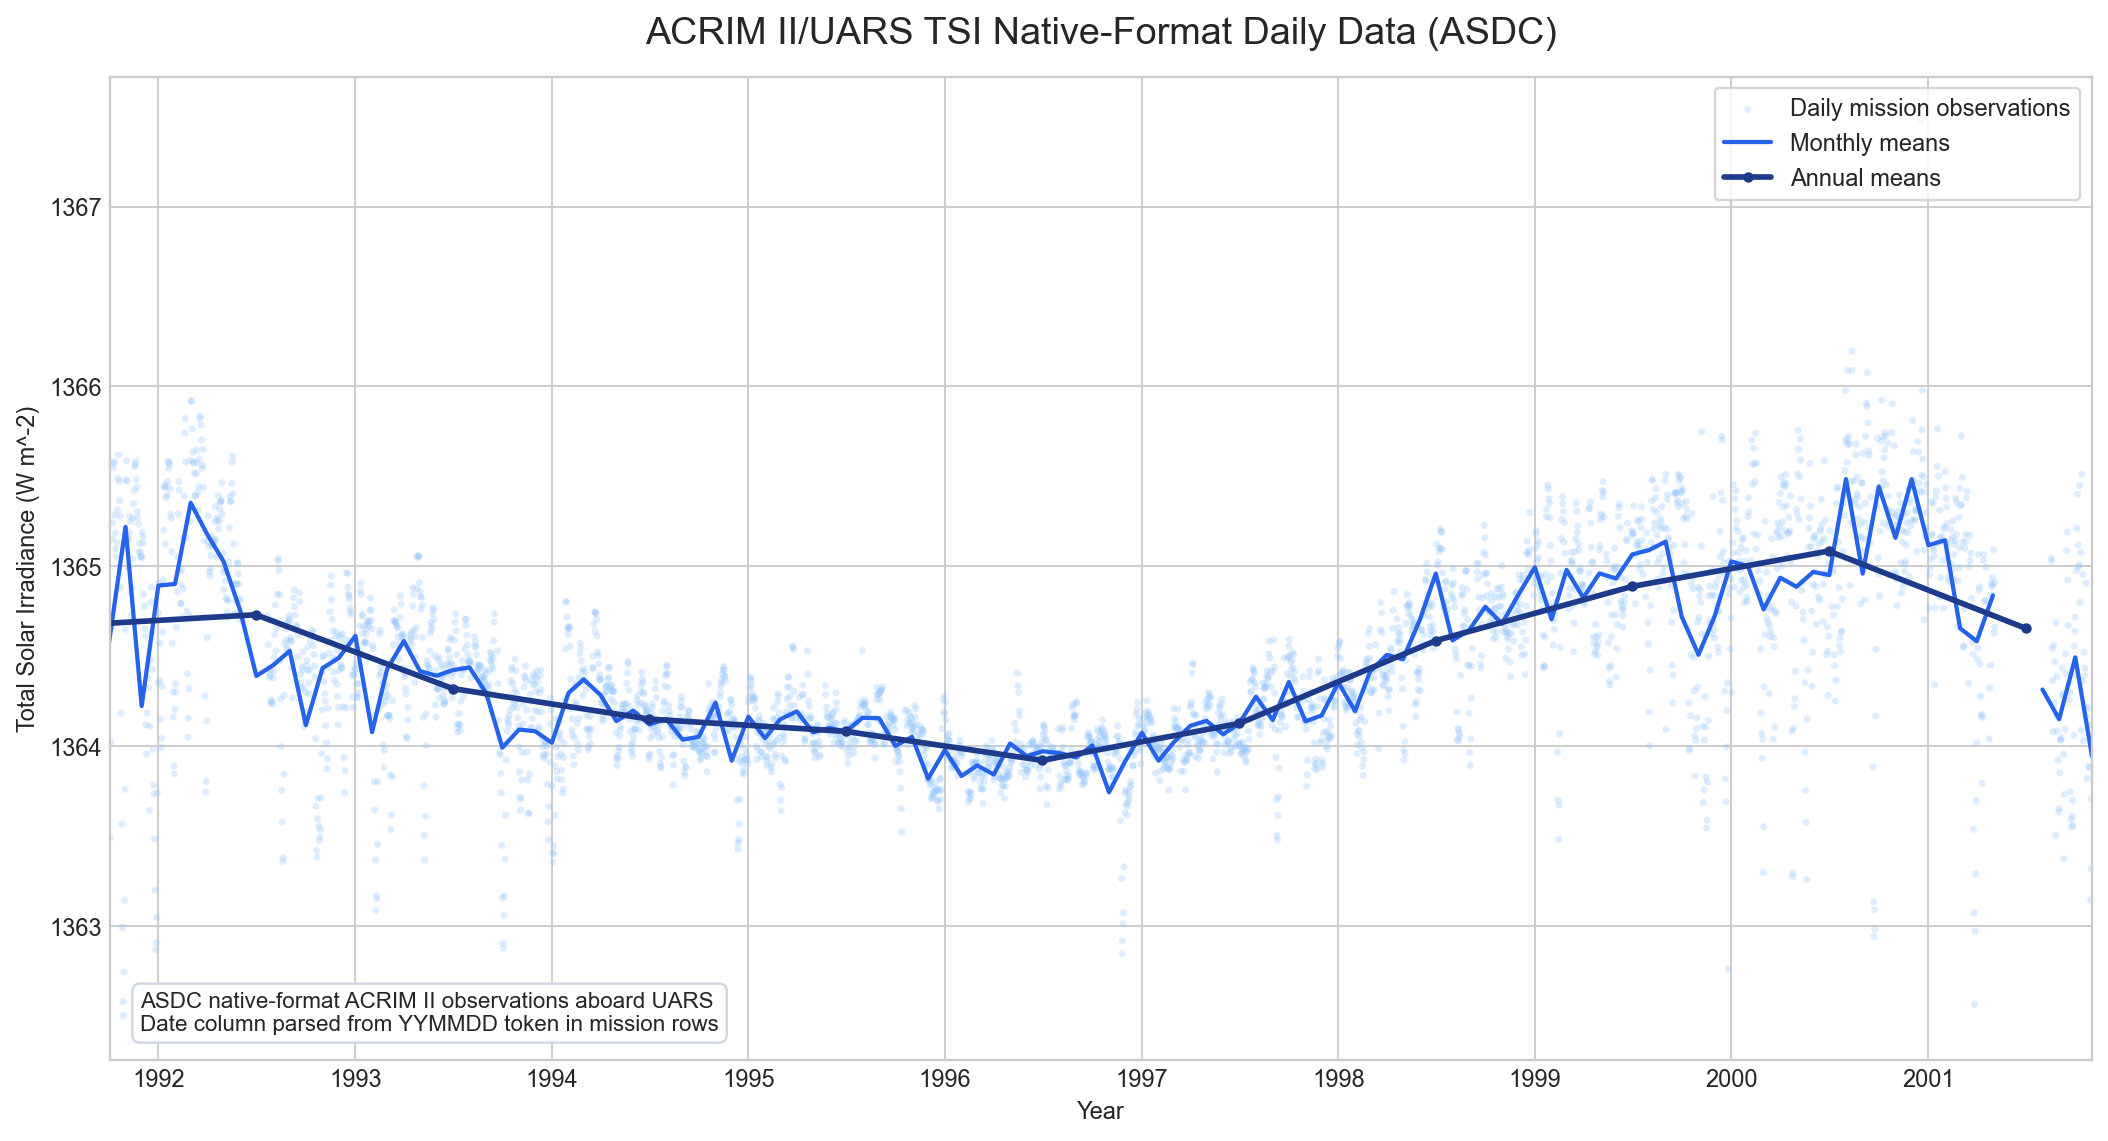
Light points: daily mission observations. Blue line: monthly means. Dark blue line/markers: annual means. Date span shown: 1991-10-04 to 2001-11-01.
ACRIM III Daily Mean TSI (ASDC HDF4 Mission Data)
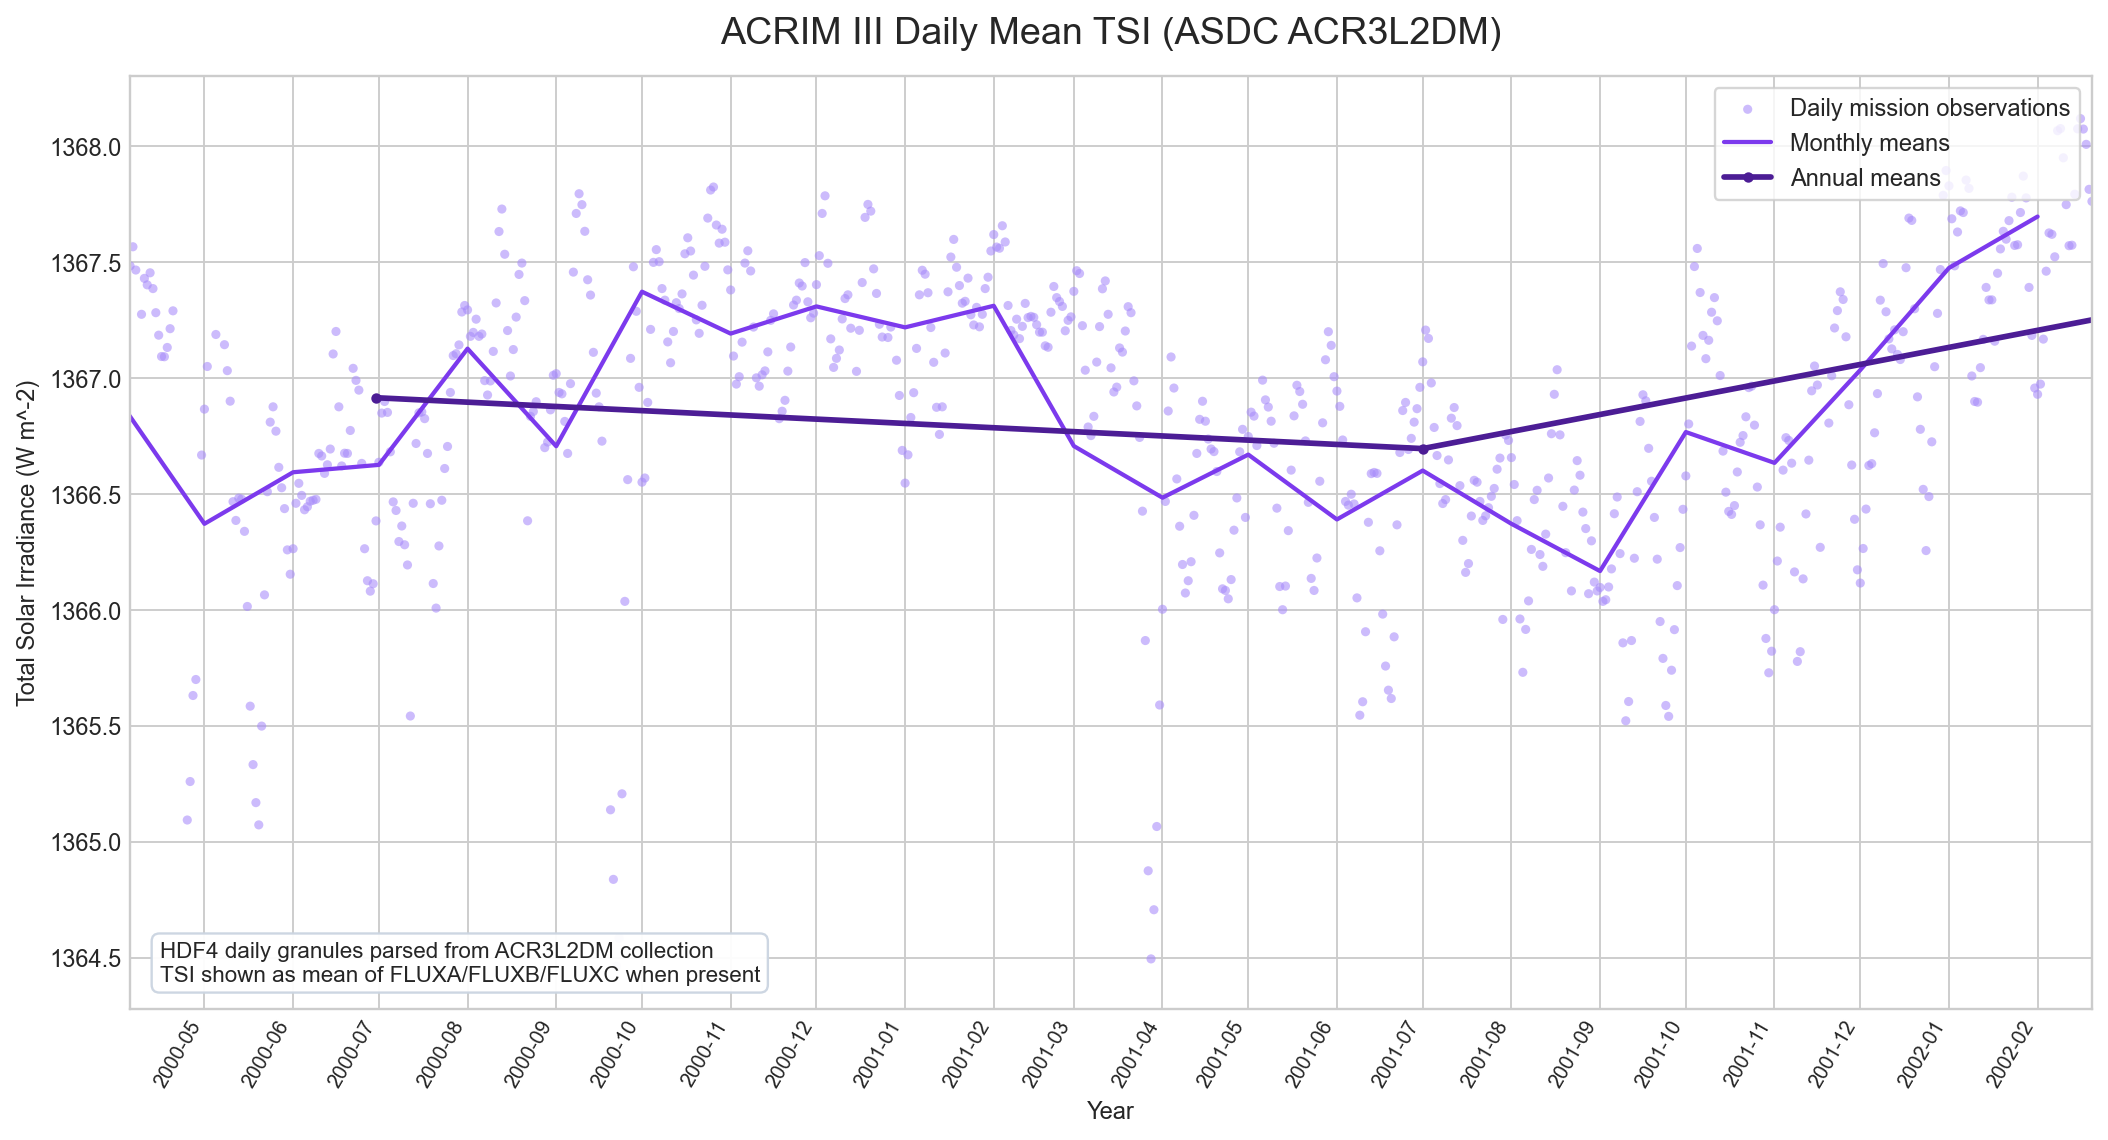
Light points: daily mission observations parsed from HDF4 granules. Purple line: monthly means. Dark purple line/markers: annual means. Date span shown: 2000-04-05 to 2002-02-20.
ACRIM III Shutter-Cycle TSI (ASDC ACR3L2SC)
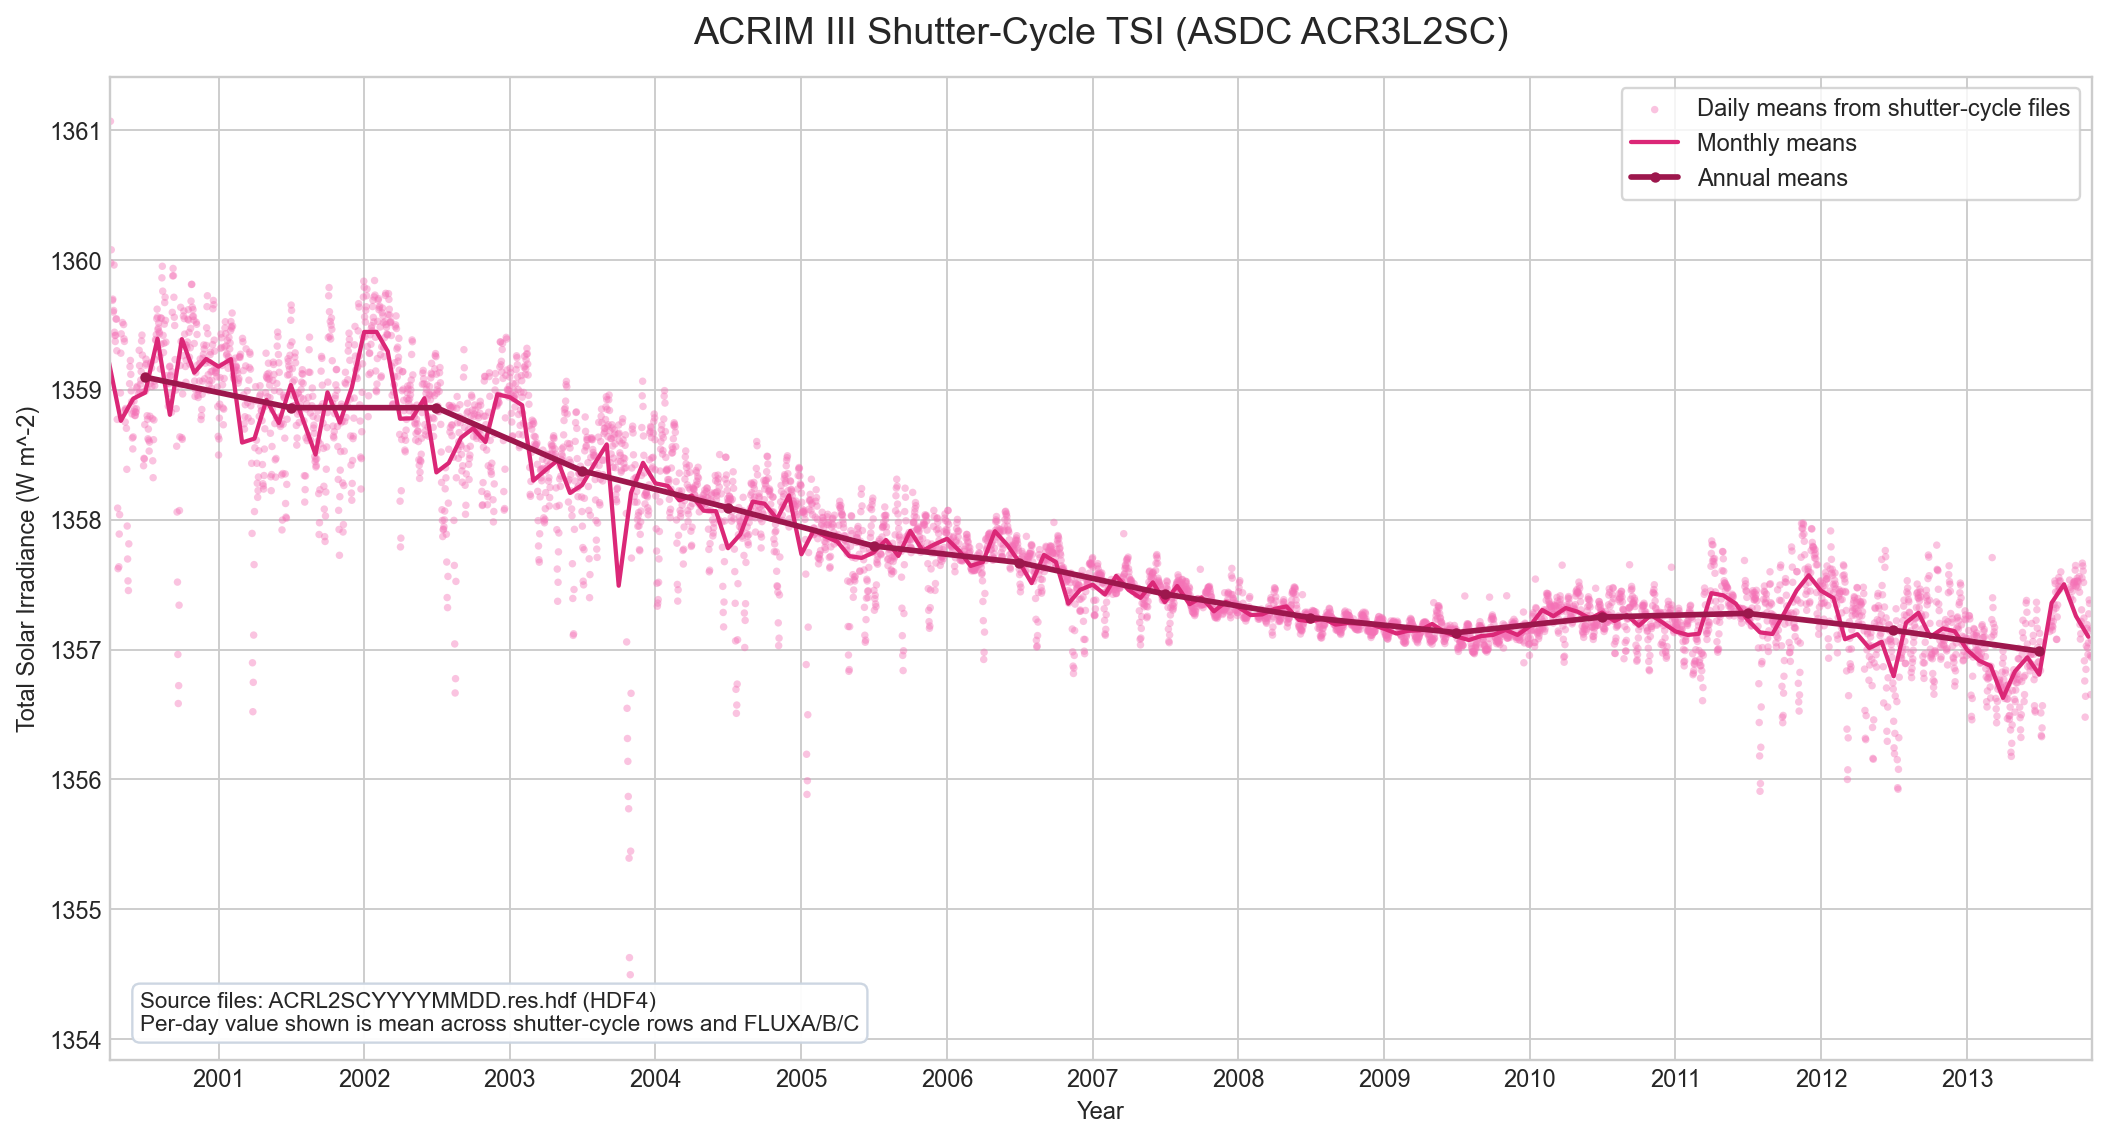
Light points: daily reduced values from shutter-cycle files. Magenta line: monthly means. Dark magenta line/markers: annual means. Date span shown: 2000-04-05 to 2013-11-10.
SOHO/VIRGO Daily TSI (IAS Archive File)
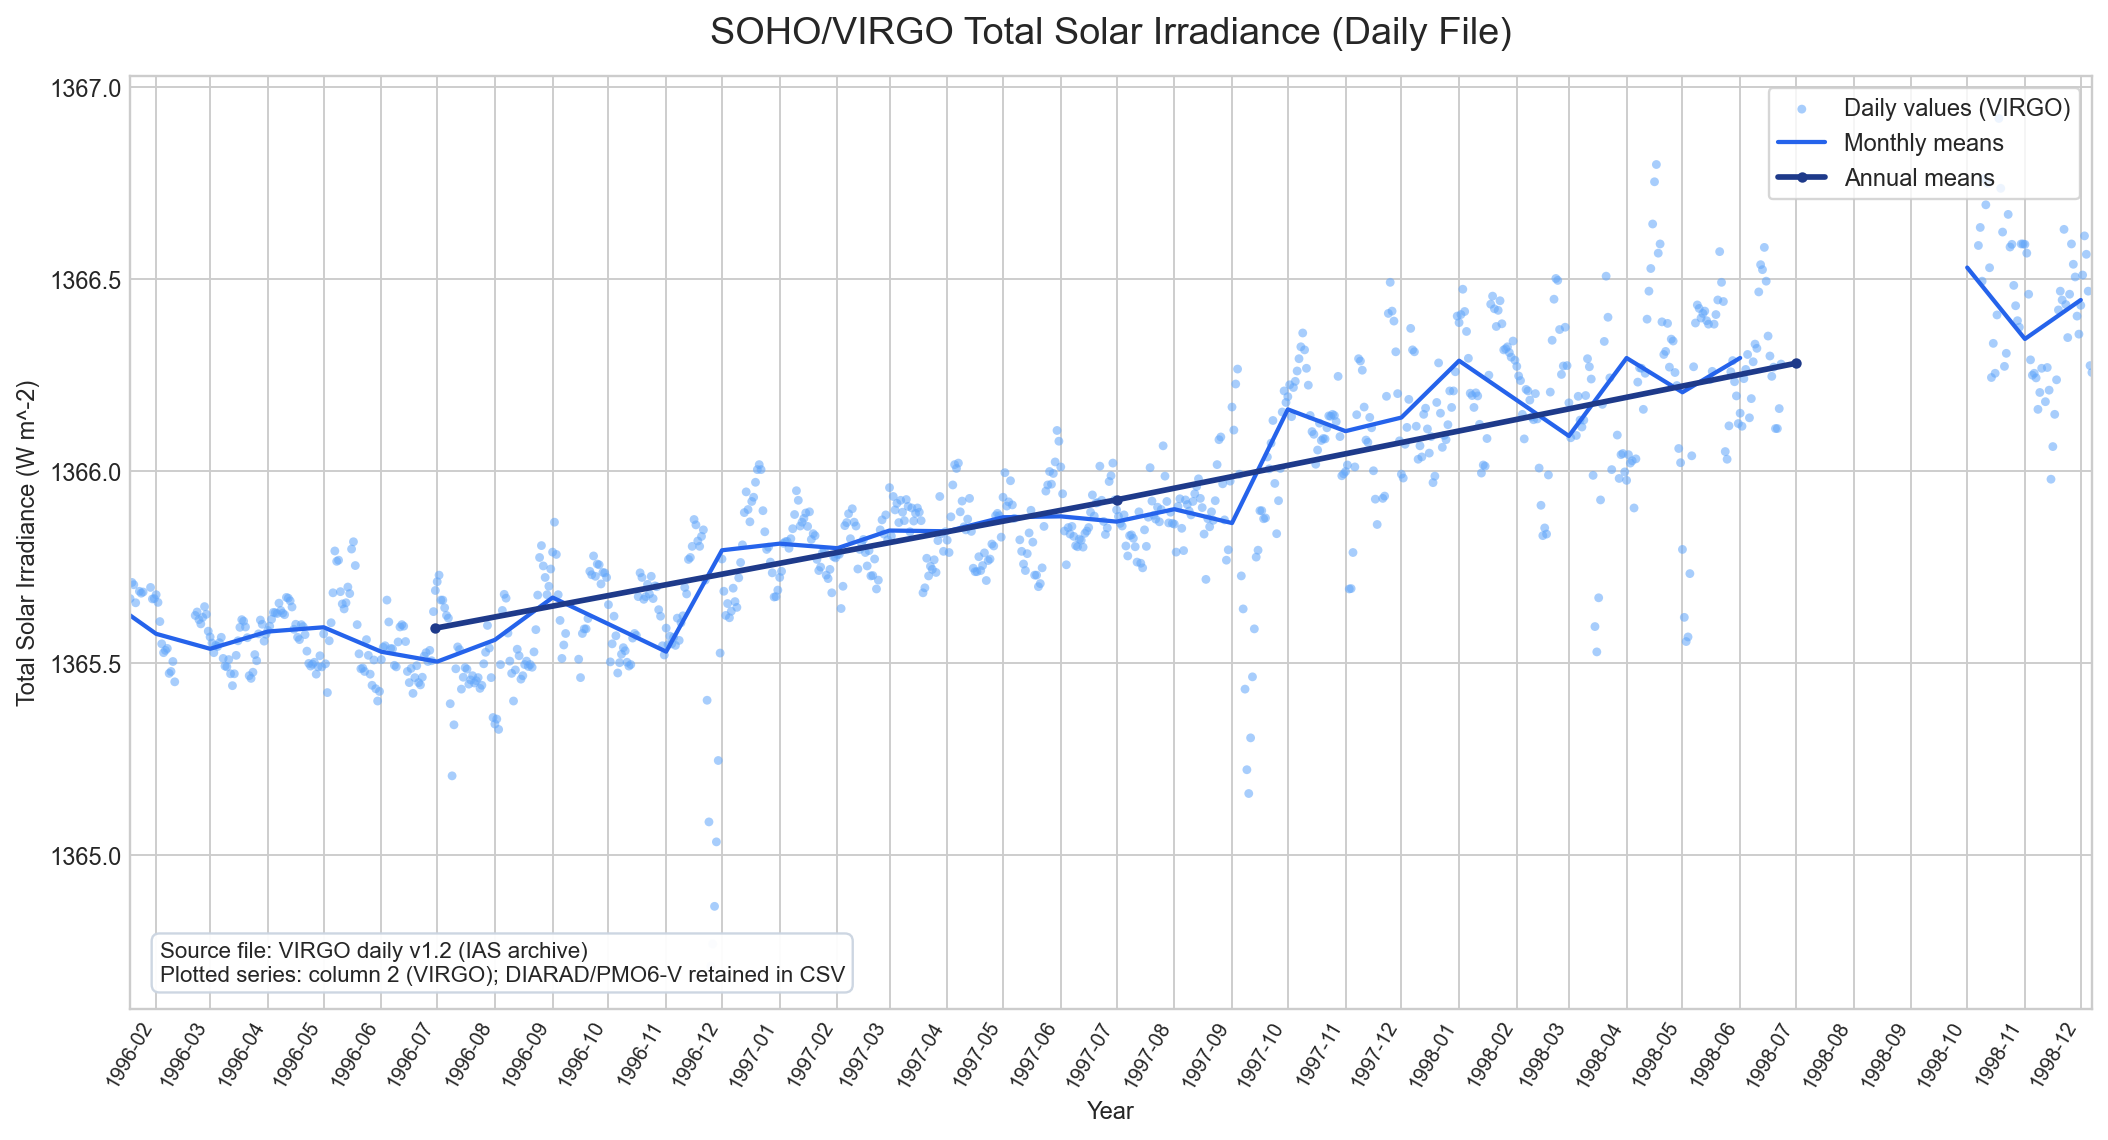
Light points: daily VIRGO values. Blue line: monthly means. Dark blue line/markers: annual means. Date span shown: 1996-01-18 to 1998-12-07.
PICARD/PREMOS N2A TSI (Mission FITS Granules)
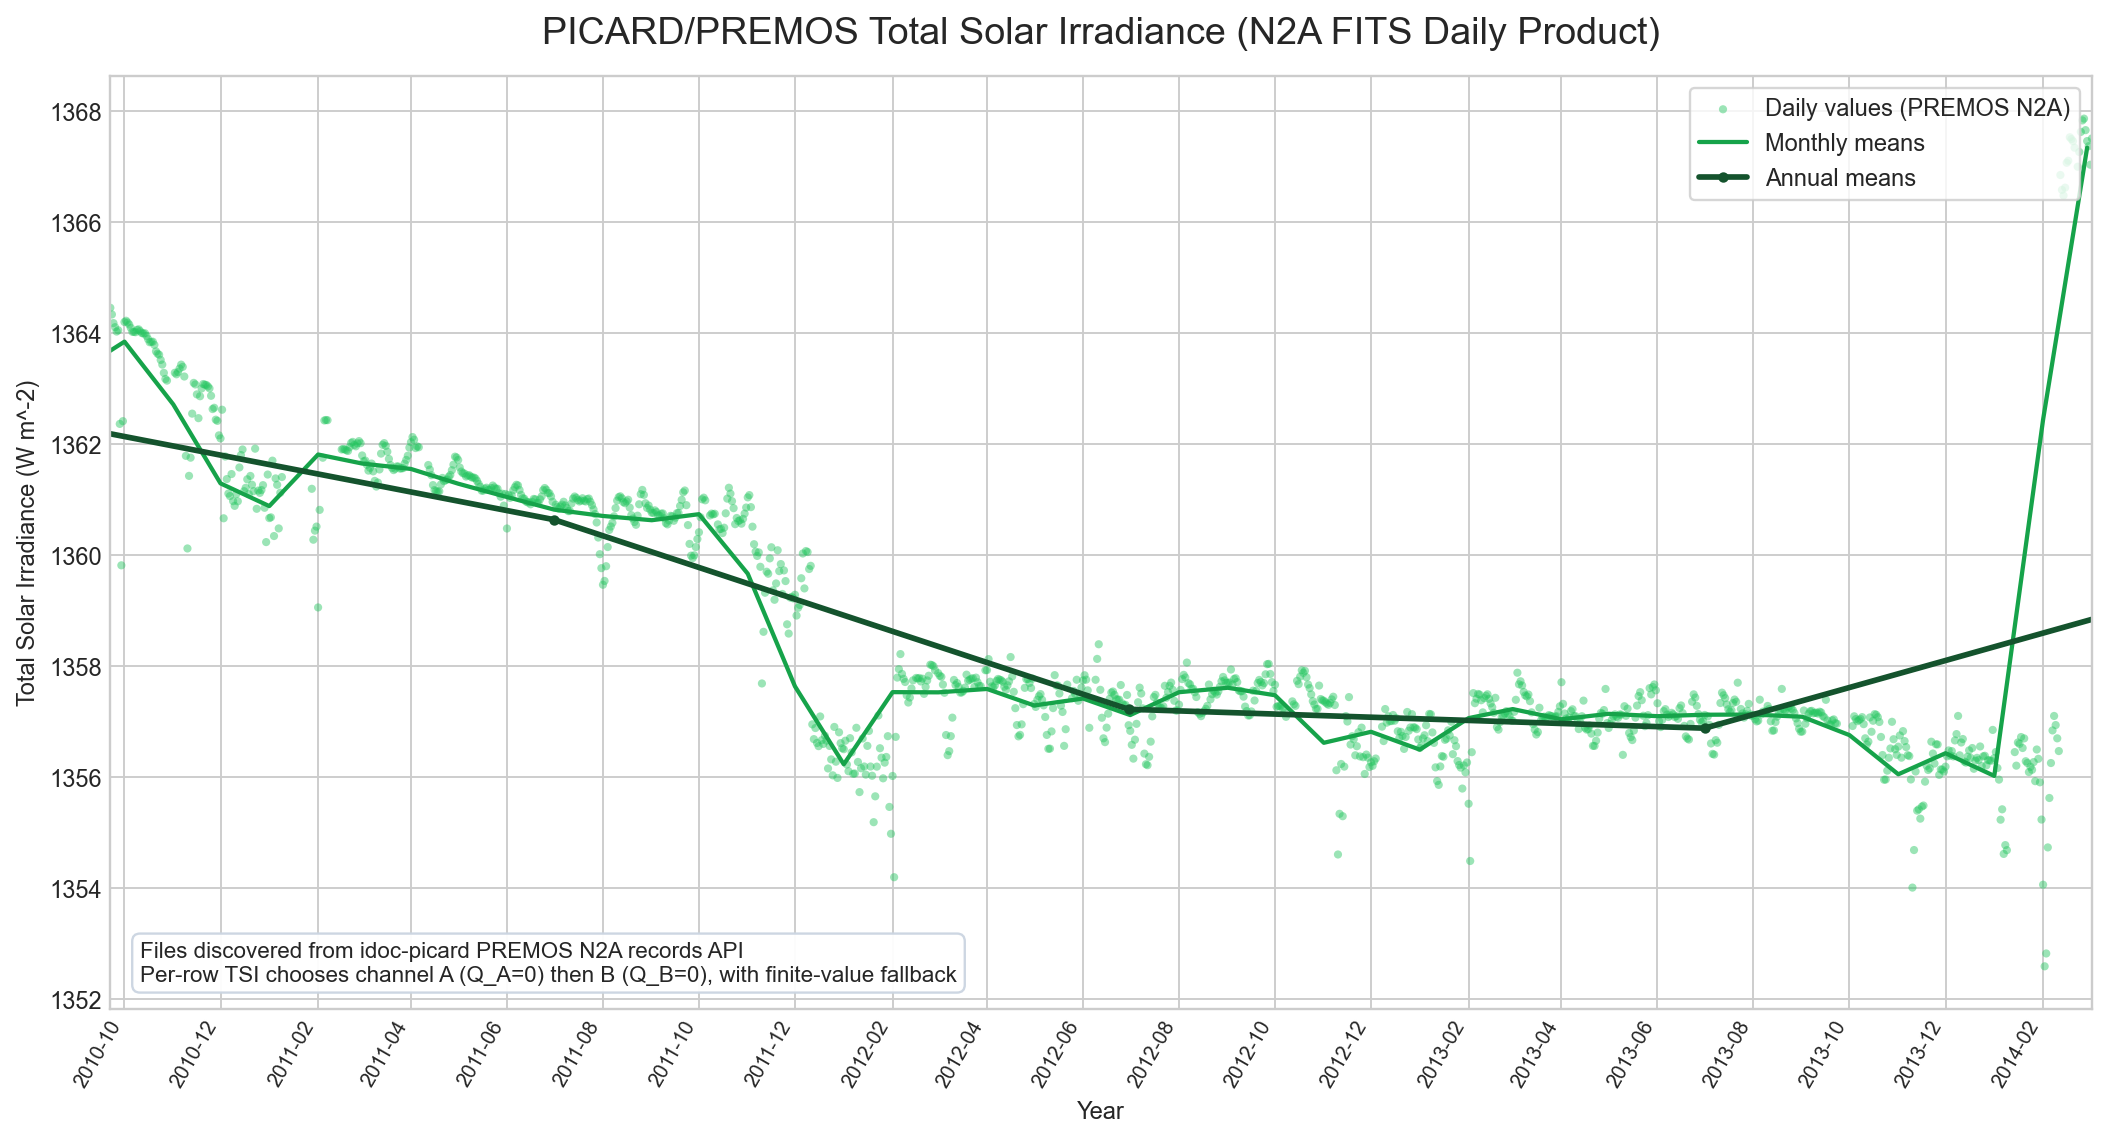
Light points: daily reduced mission values. Green line: monthly means. Dark green line/markers: annual means. Date span shown: 2010-09-22 to 2014-03-04.
SOHO/VIRGO Full Mission (Version 8.0)
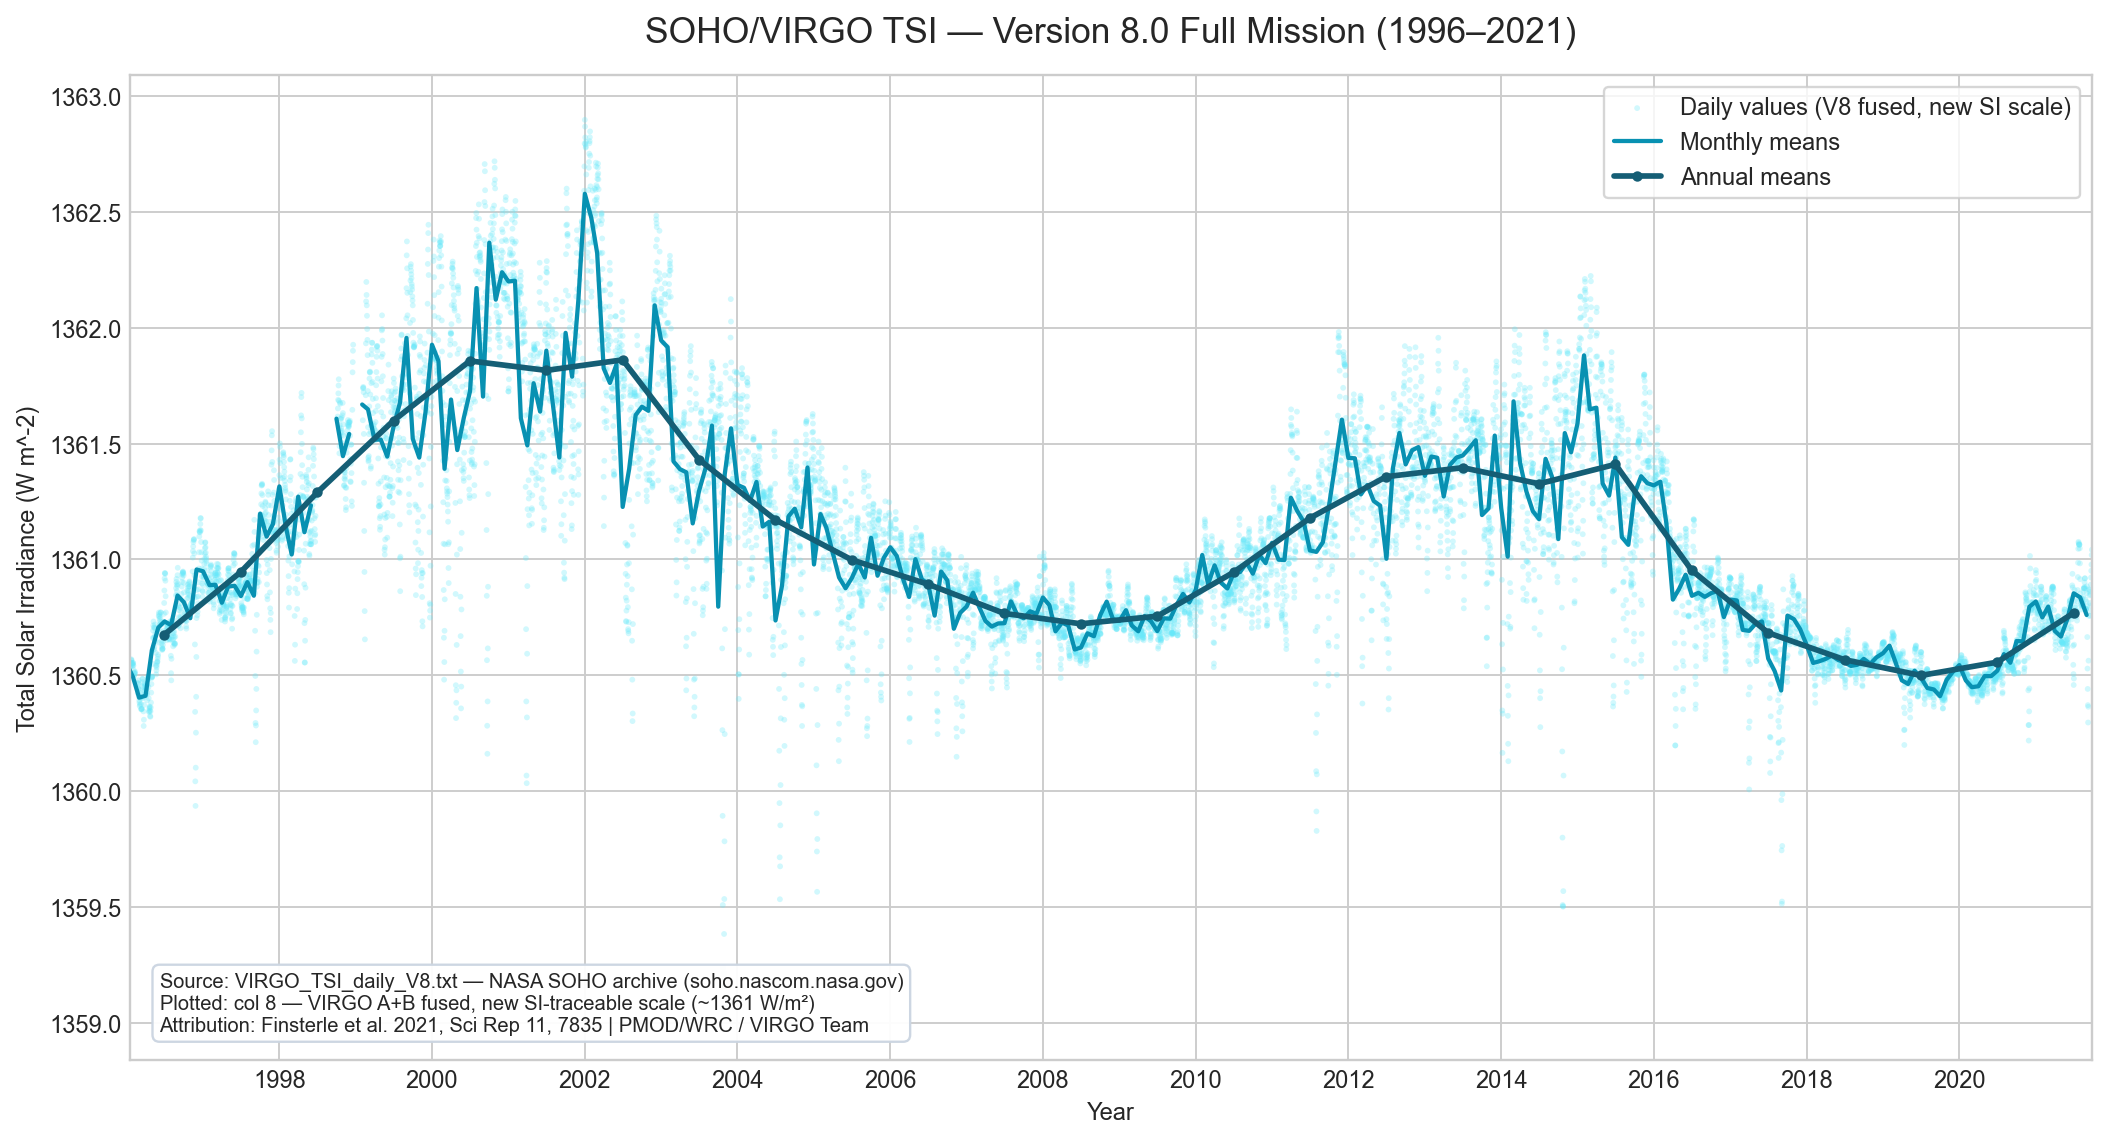
Cyan points: daily values (fused new SI-traceable scale). Blue line: monthly means. Dark teal line/markers: annual means. Date span: 1996-01-18 to 2021-09-26 (9169 daily rows).
ACRIM I / Solar Maximum Mission (SMM) TSI
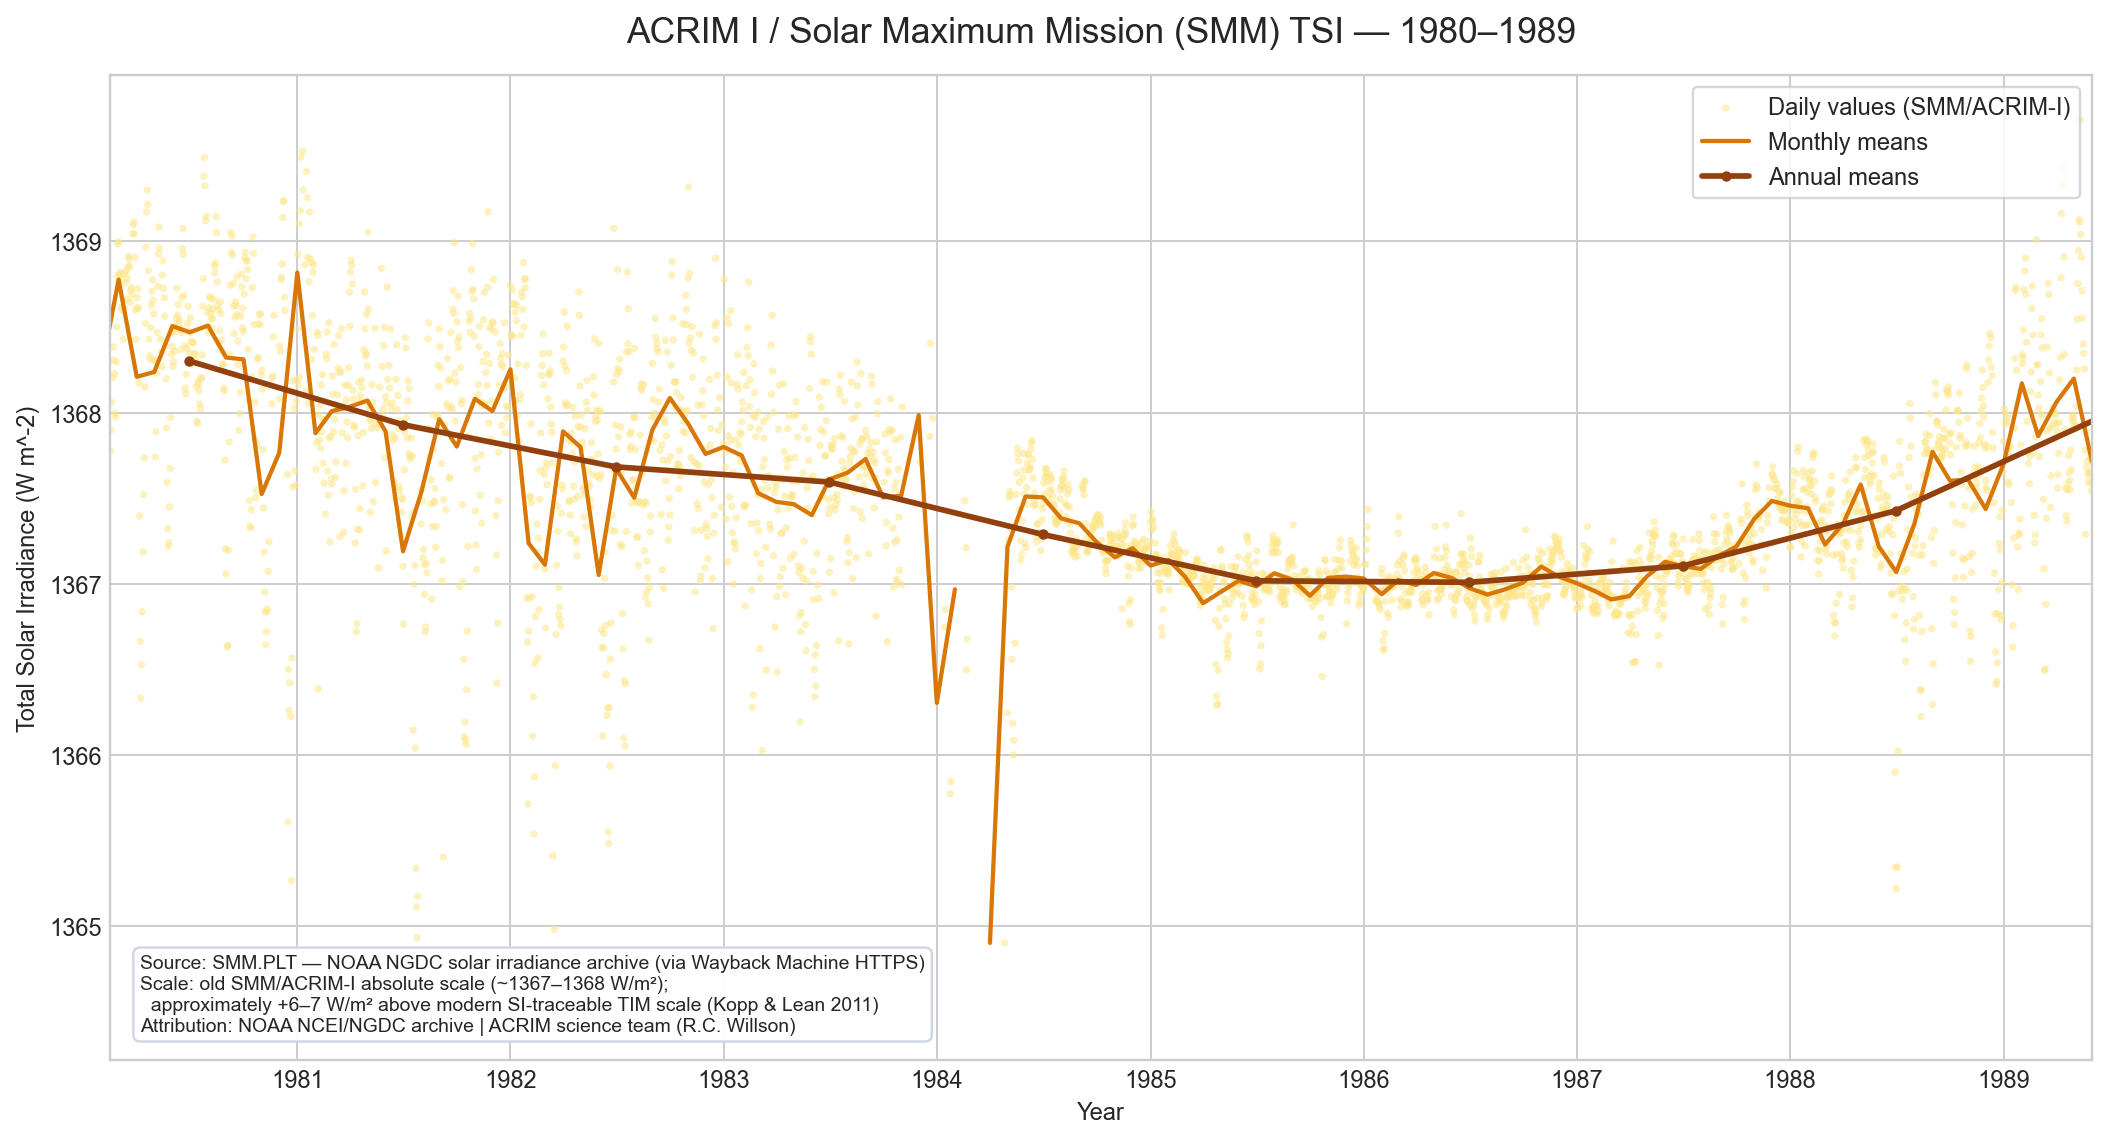
Amber points: daily values (old SMM absolute scale ~1367–1368 W/m²). Orange line: monthly means. Dark amber line/markers: annual means. Date span: 1980-02-16 to 1989-06-01 (3053 daily rows). Note: the absolute level is ~6–7 W/m² above modern TIM values.
PICARD/SOVAP TSI Composite
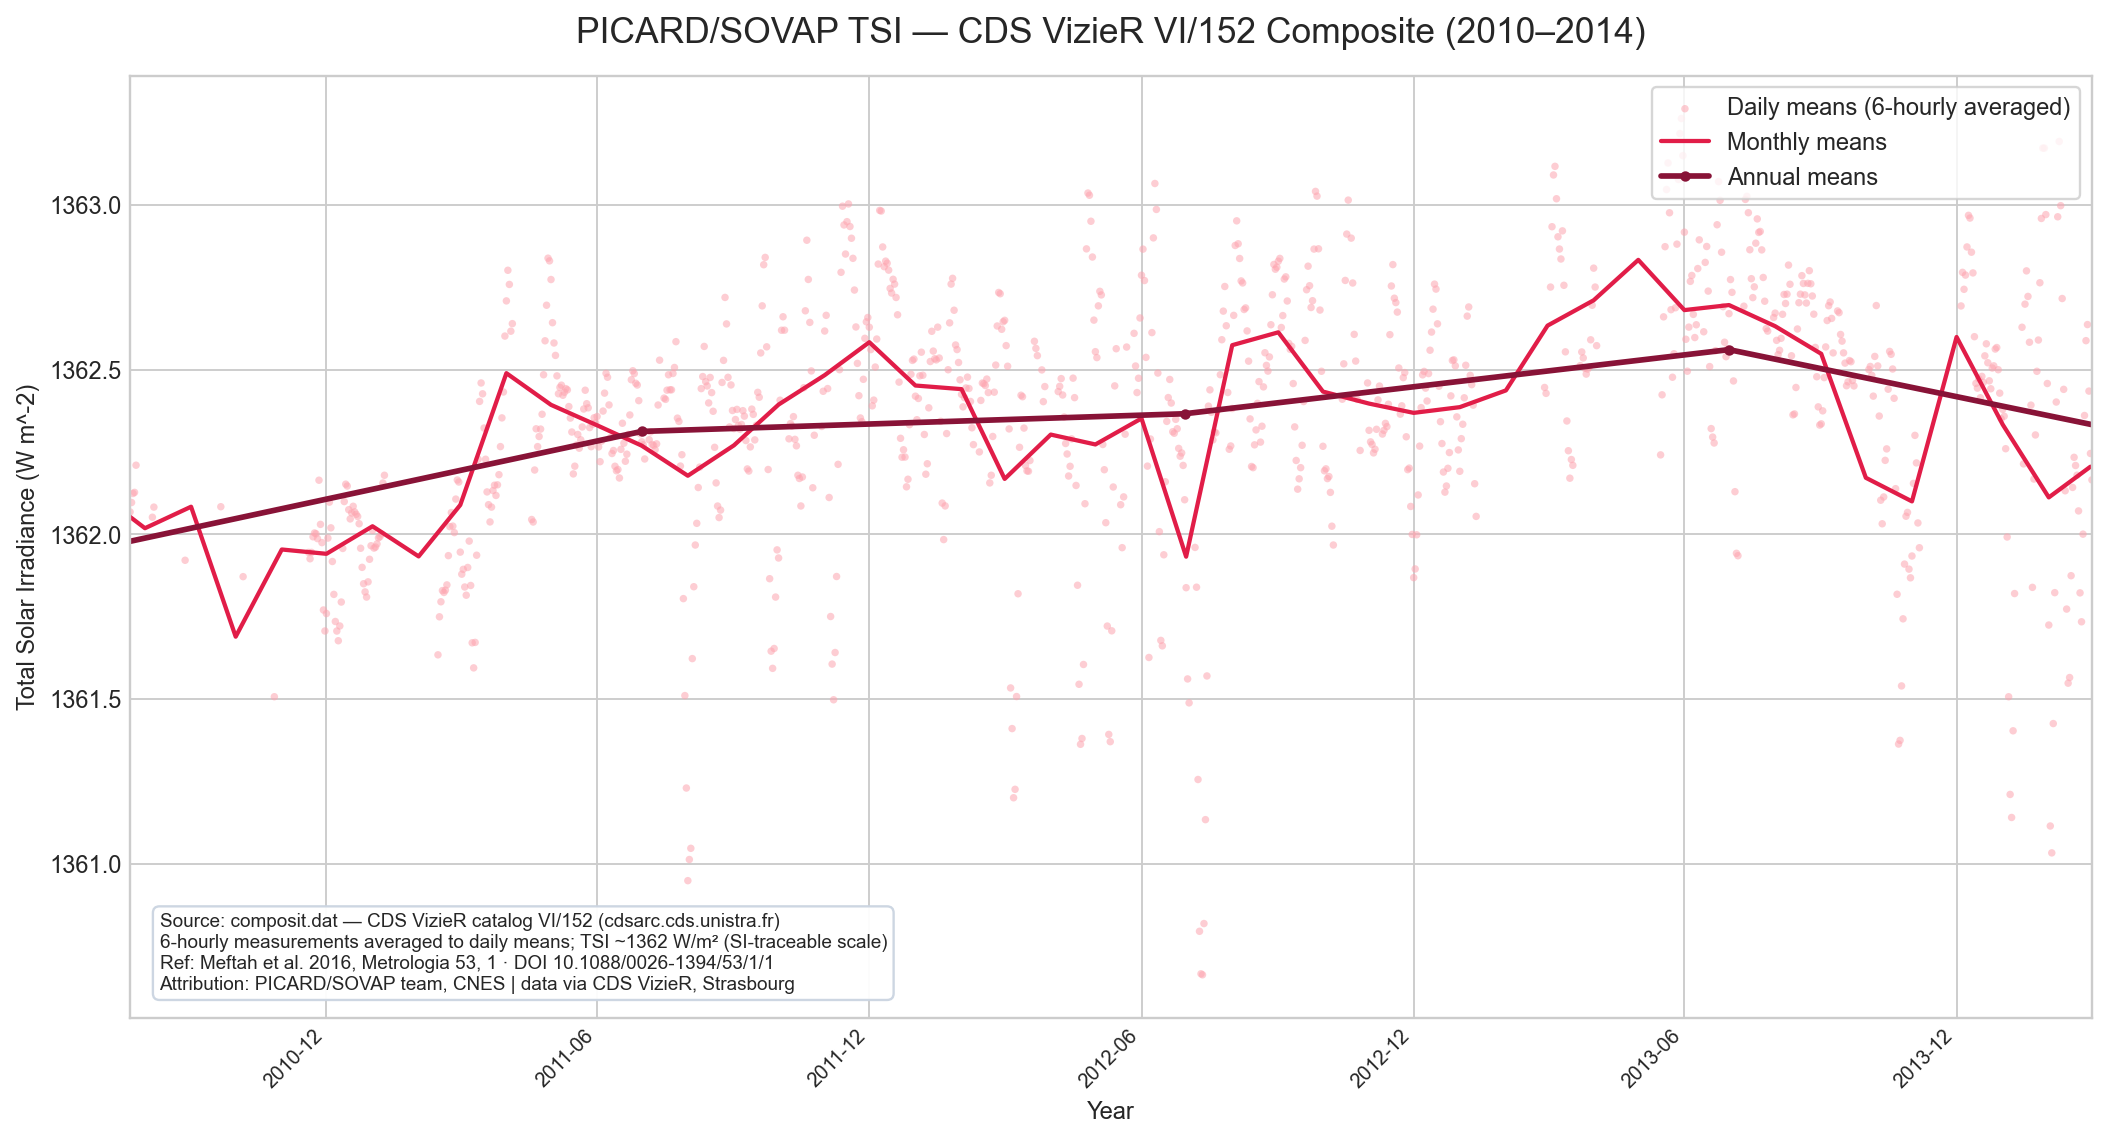
Rose/pink points: daily means (6-hourly averaged). Red line: monthly means. Dark red line/markers: annual means. Date span: 2010-07-22 to 2014-03-02 (974 daily values). TSI ~1361–1363 W/m².
SORCE/TIM
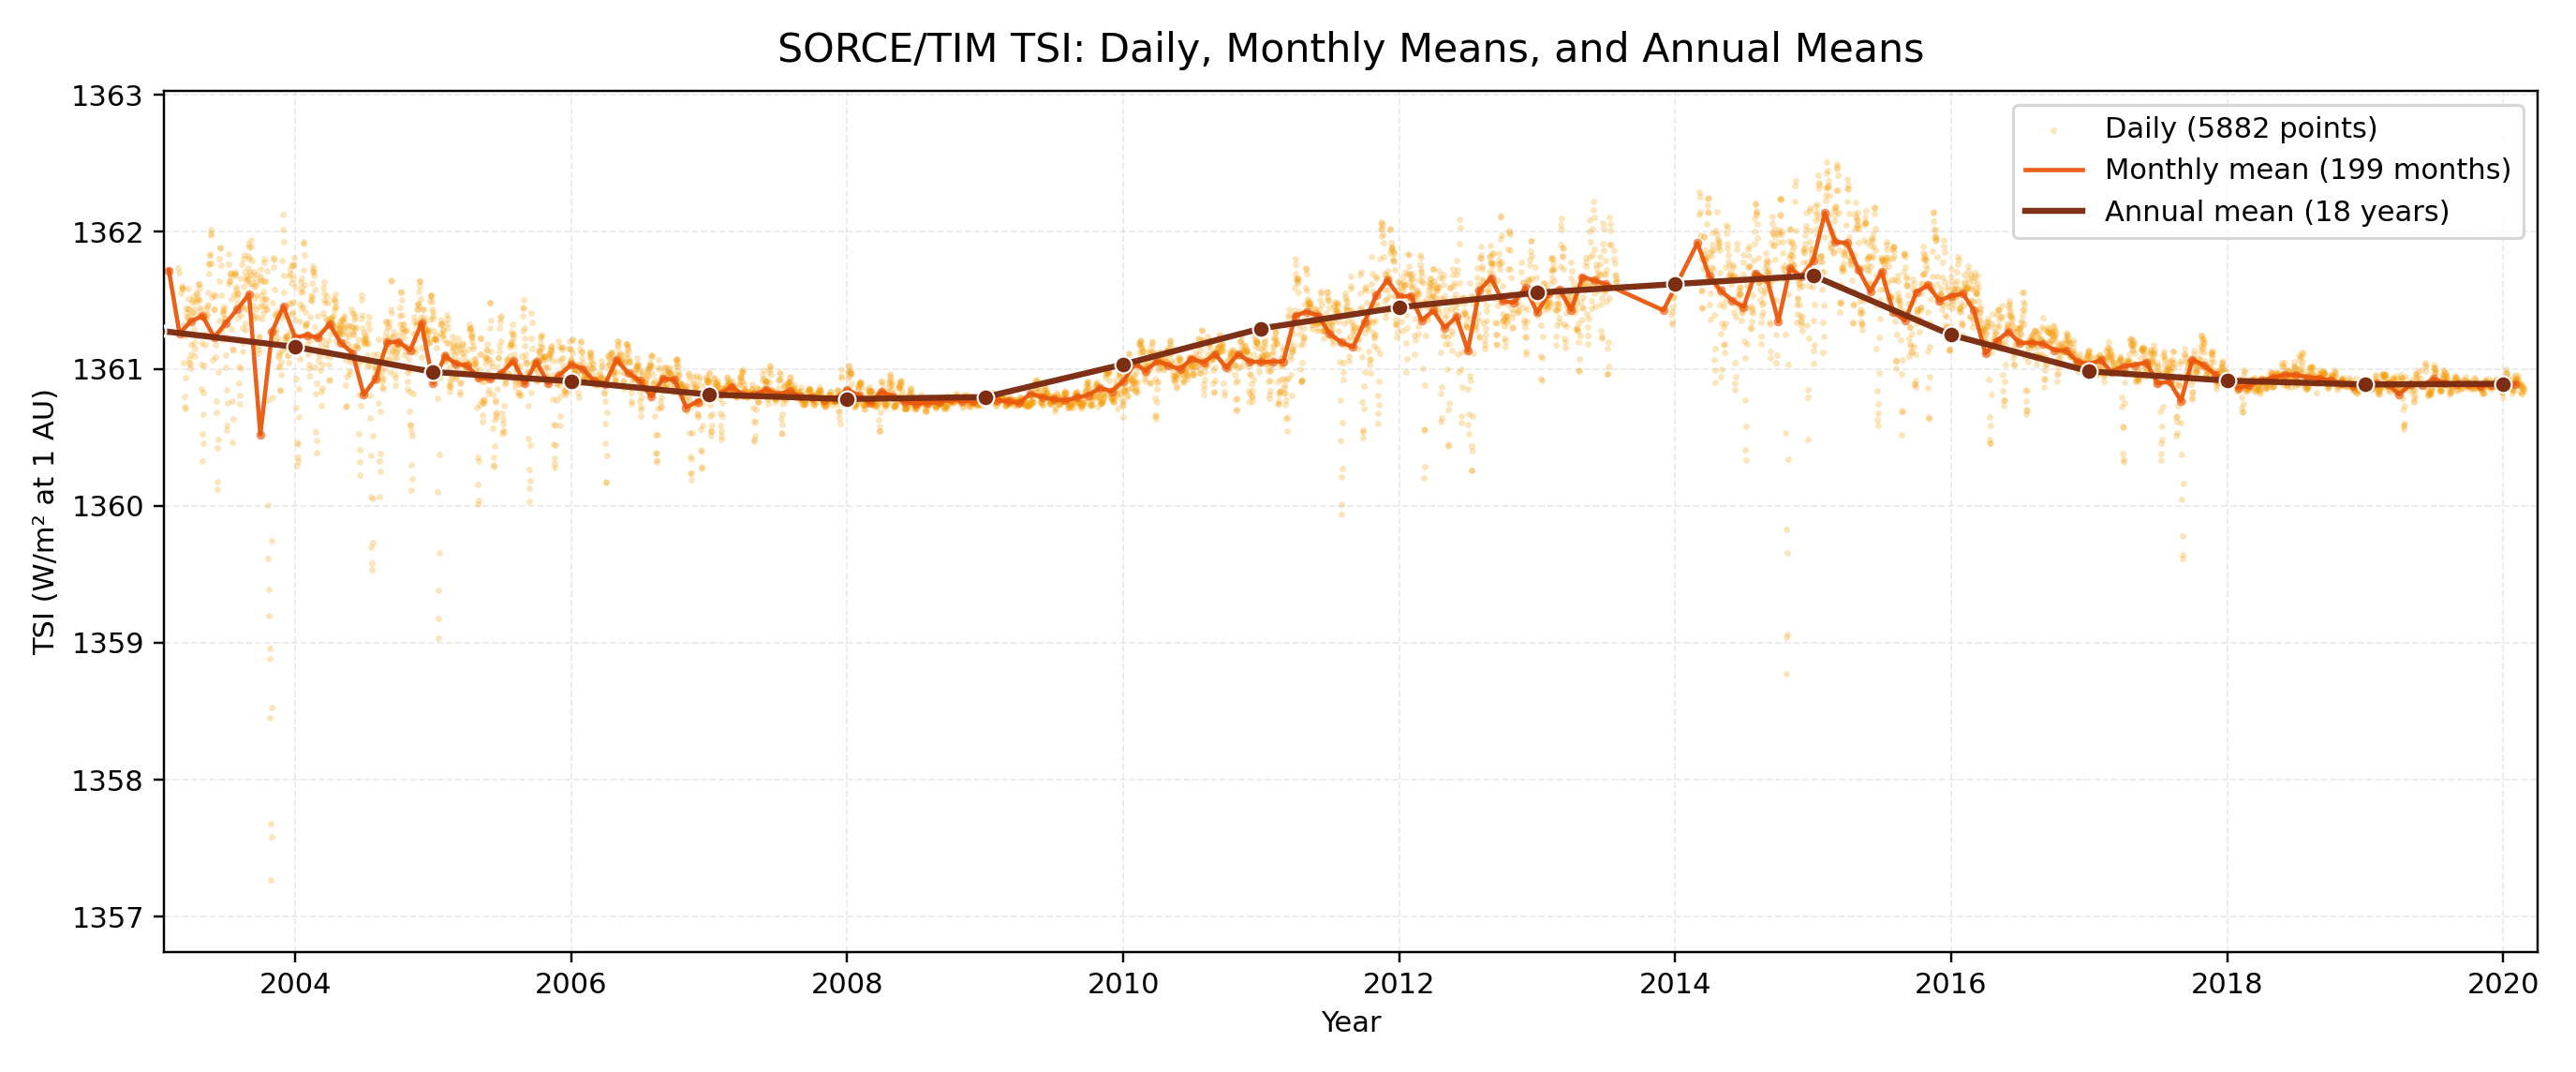
Light points: daily values. Orange line: monthly means. Dark line/markers: annual means.
TCTE/TIM
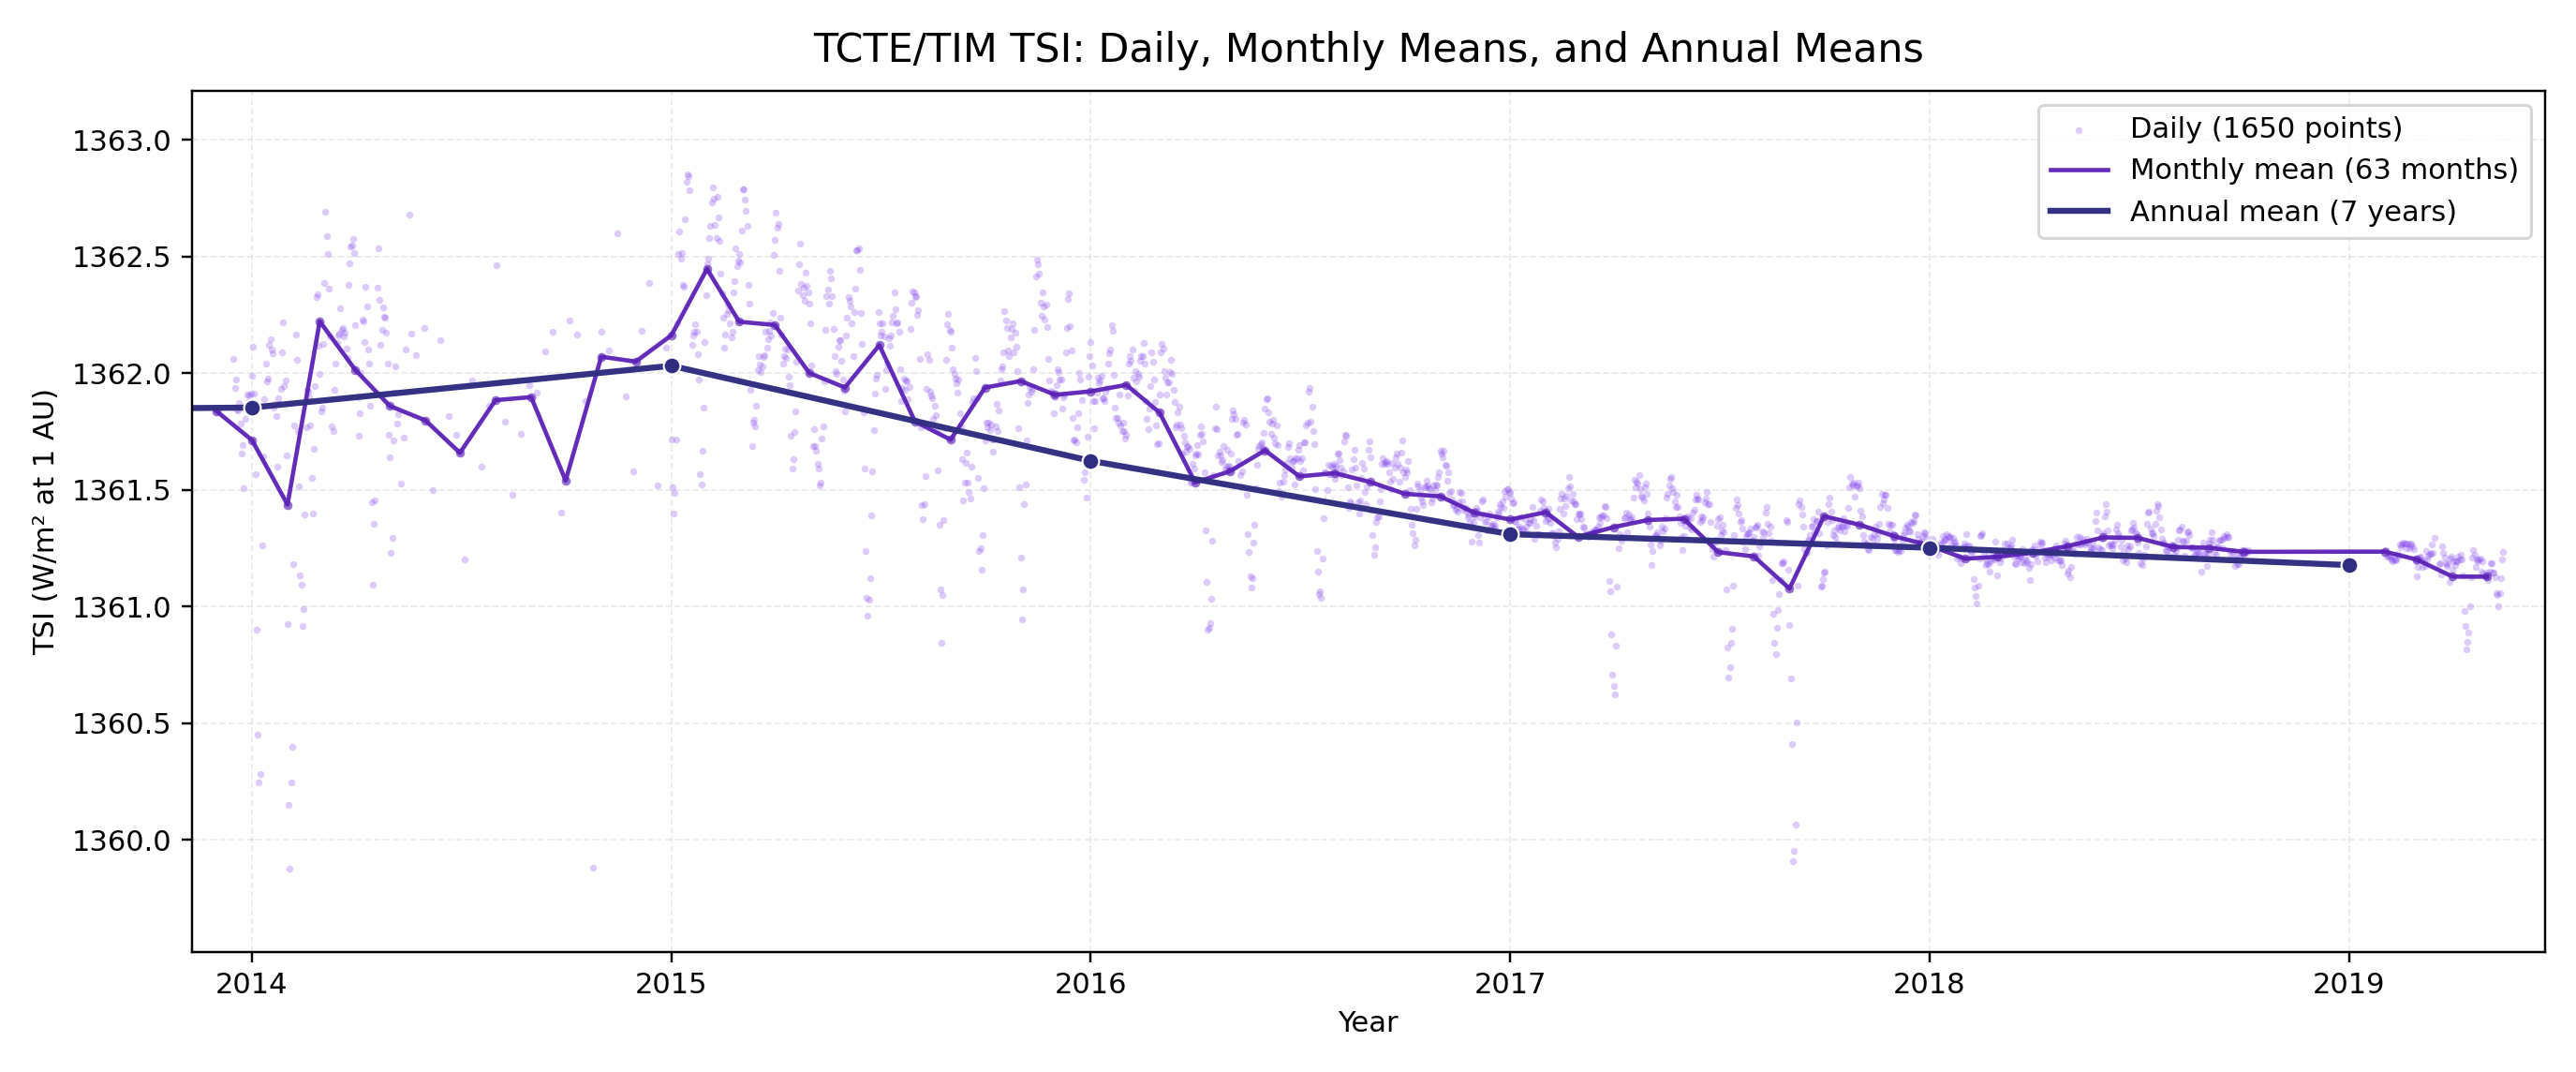
Light points: daily values. Purple line: monthly means. Dark line/markers: annual means.
TSIS-1/TIM
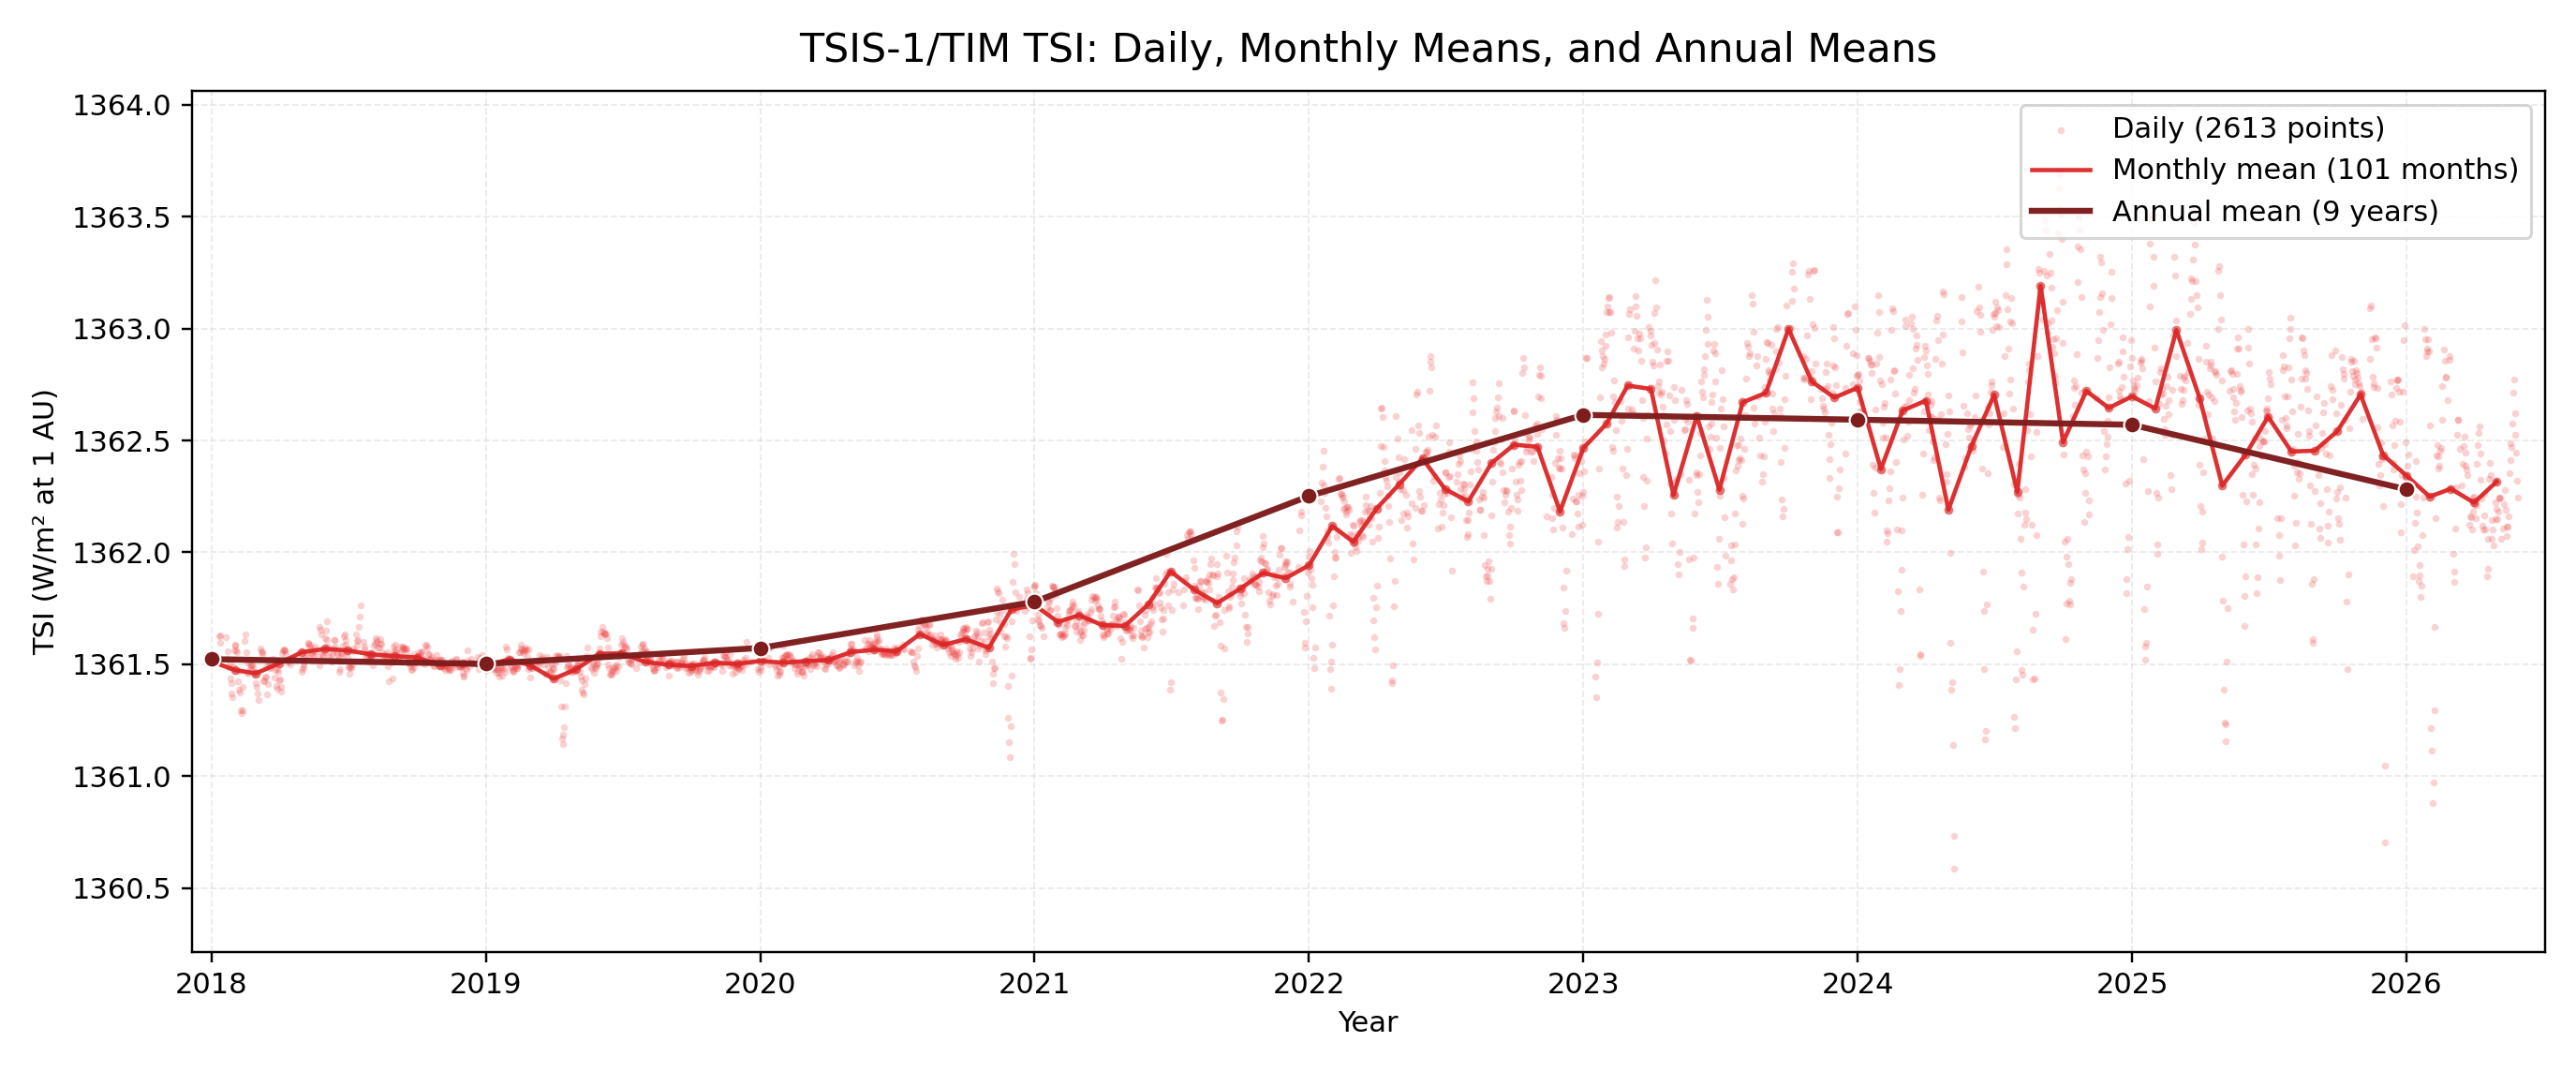
Light points: daily values. Red line: monthly means. Dark line/markers: annual means.
SORCE/TIM Versioned Archive (GES DISC SOR3TSID v19)
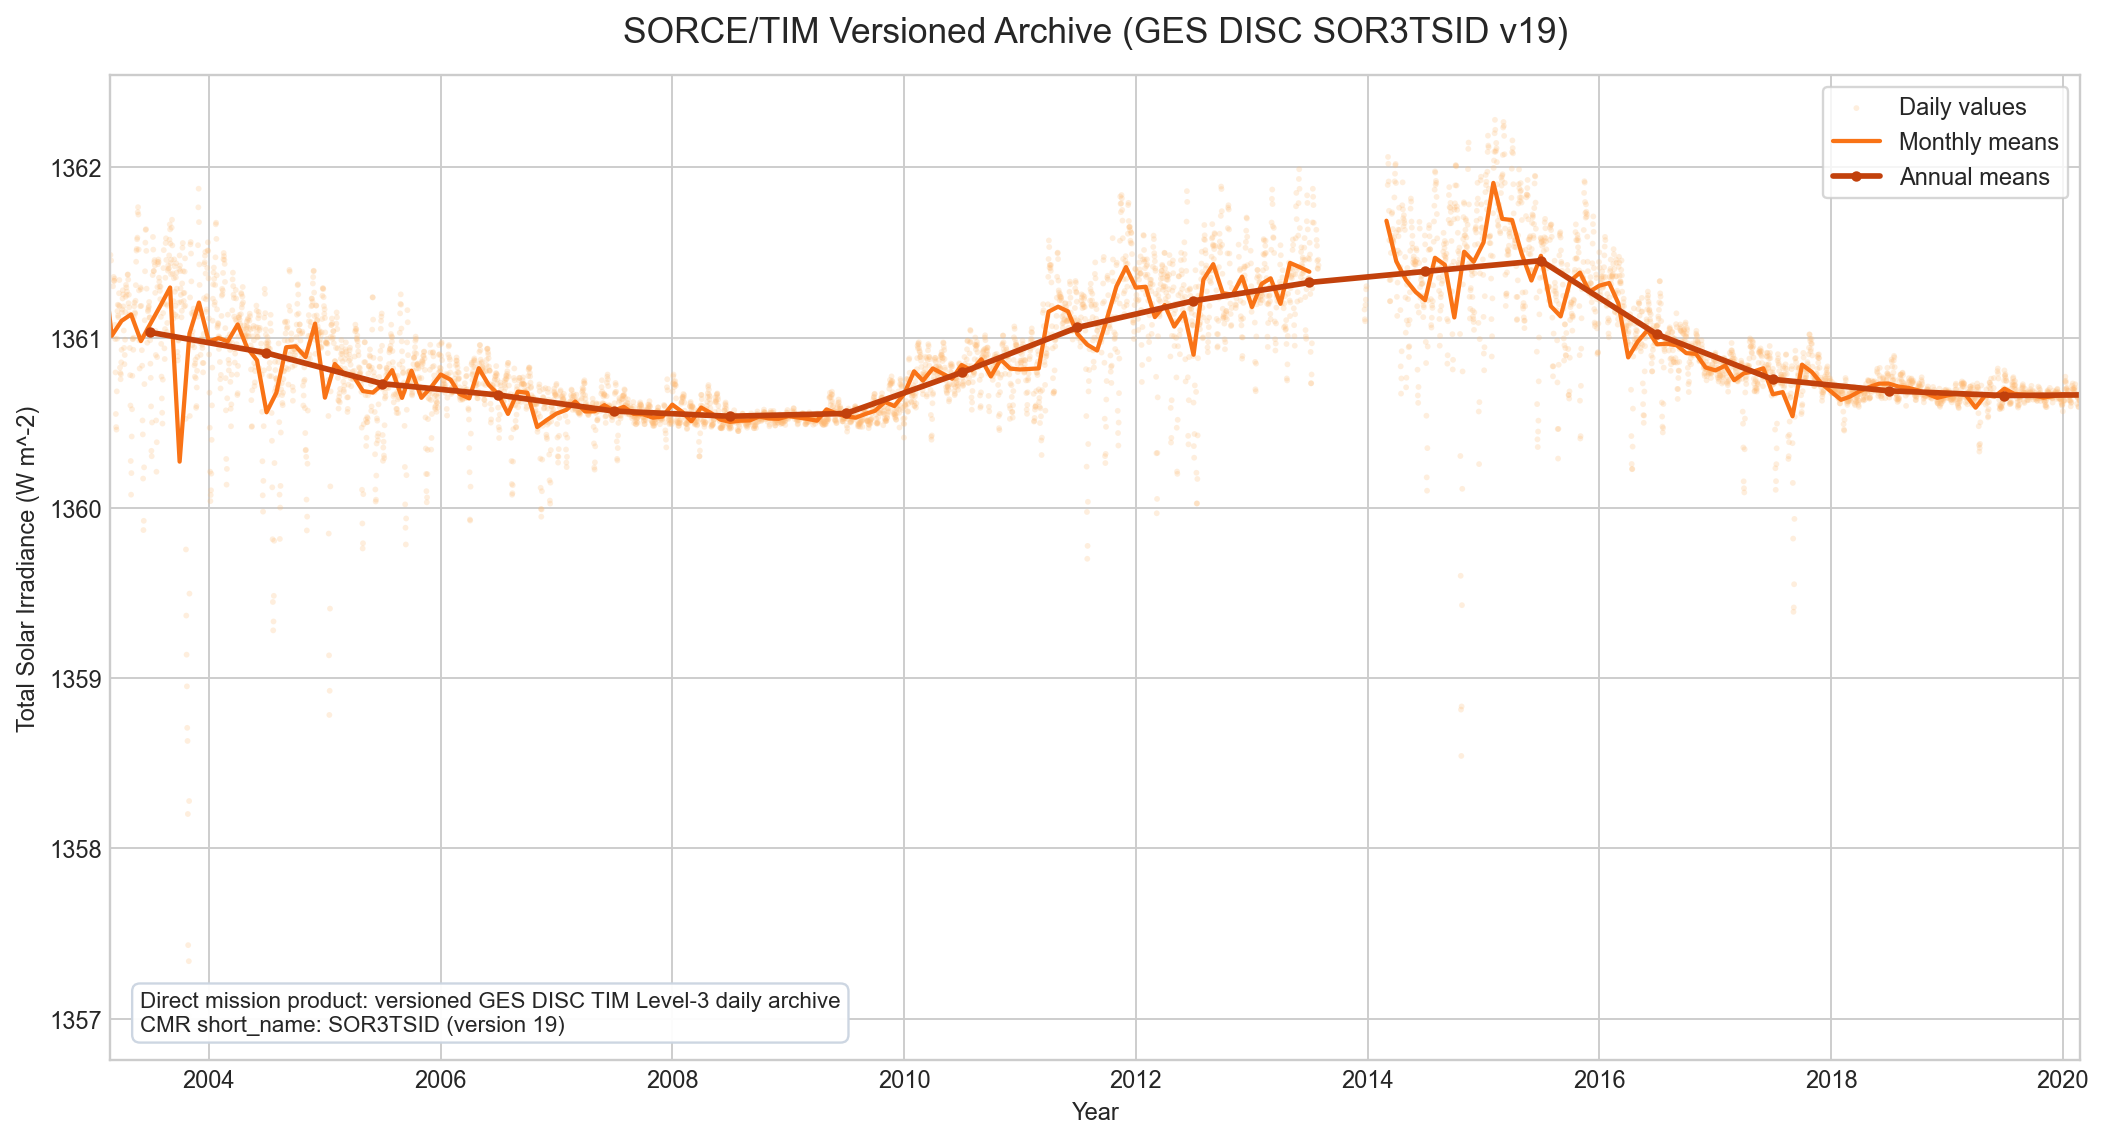
Light points: daily mission values. Orange line: monthly means. Dark line/markers: annual means. Date span shown: 2003-02-25 to 2020-02-25.
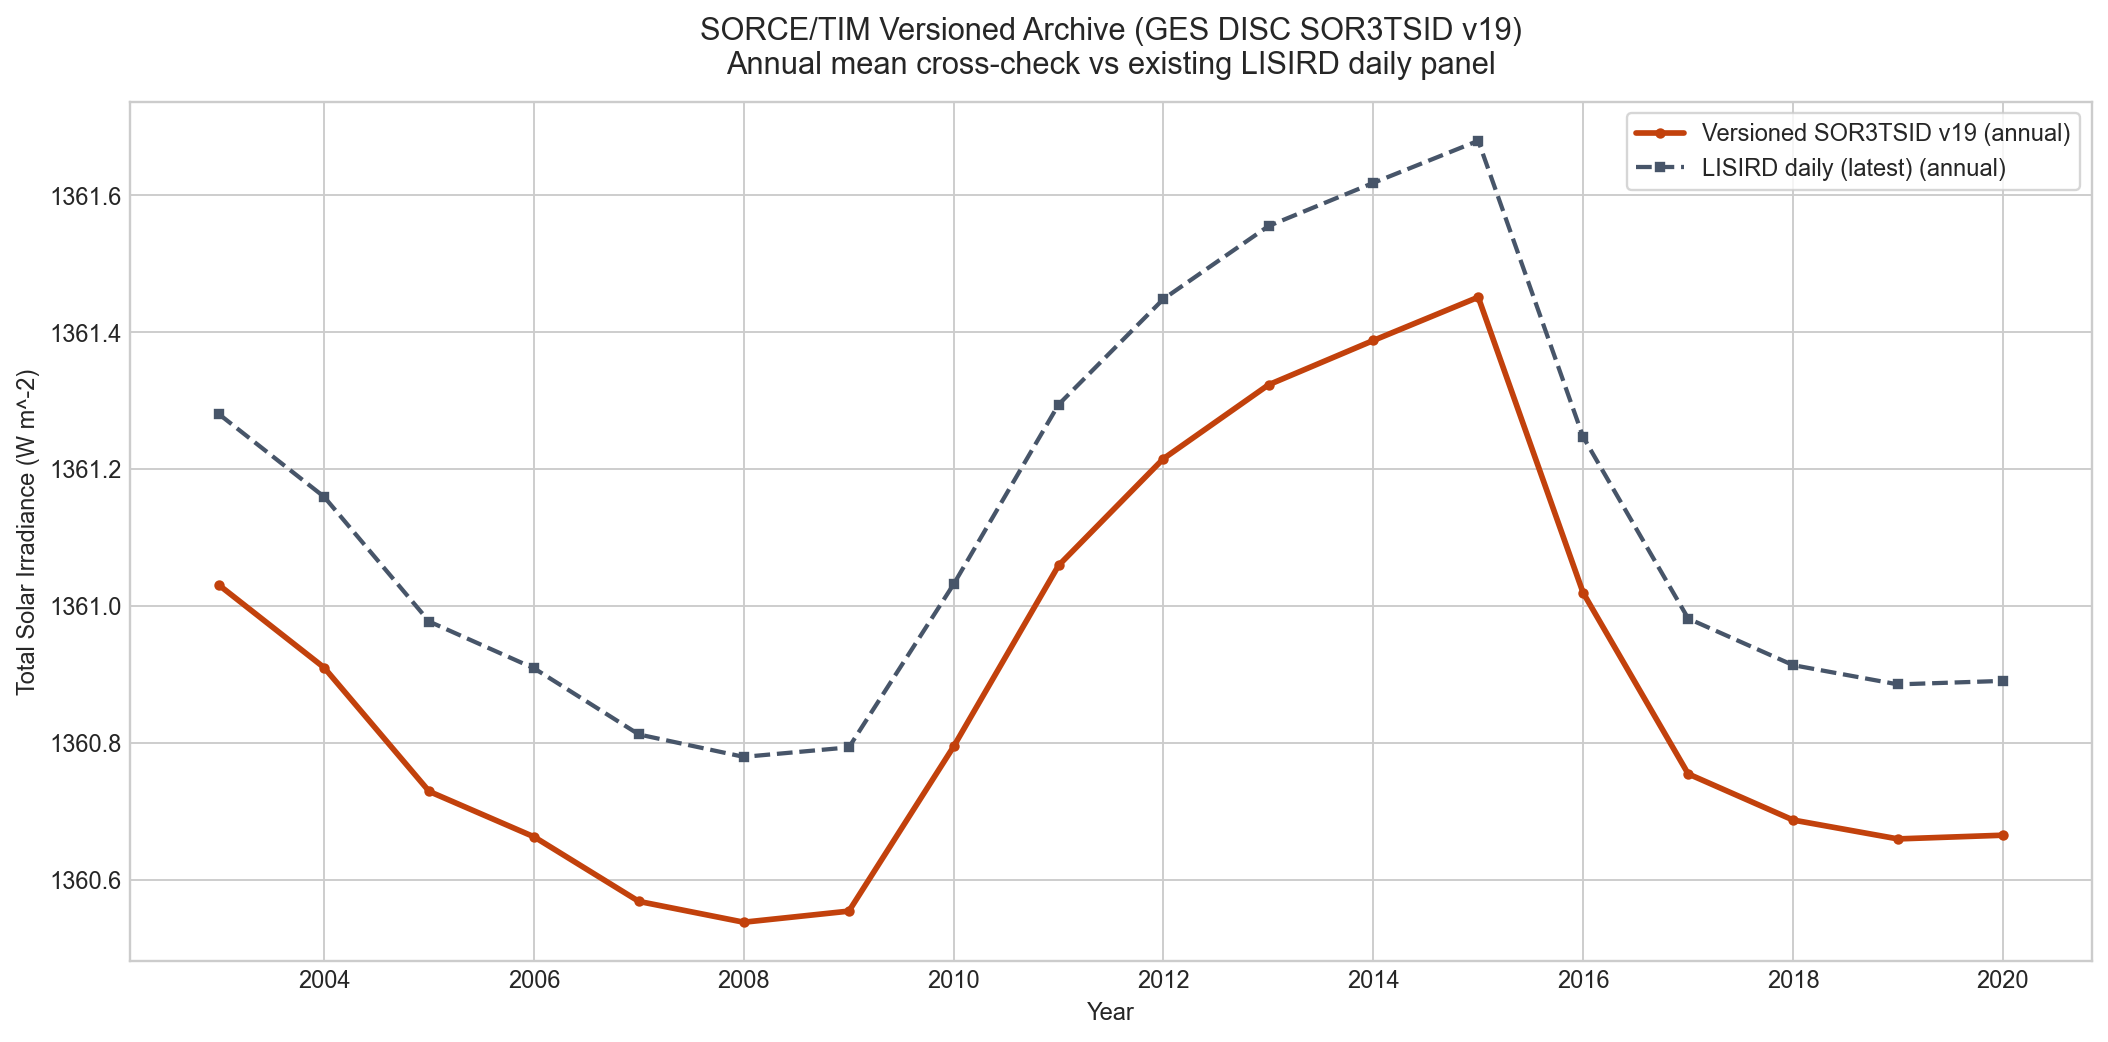
Cross-check: annual means from the versioned SOR3TSID v19 archive (solid) against the existing LISIRD daily SORCE feed (dashed).
TCTE/TIM Versioned Archive (GES DISC TCTE3TSID v04)
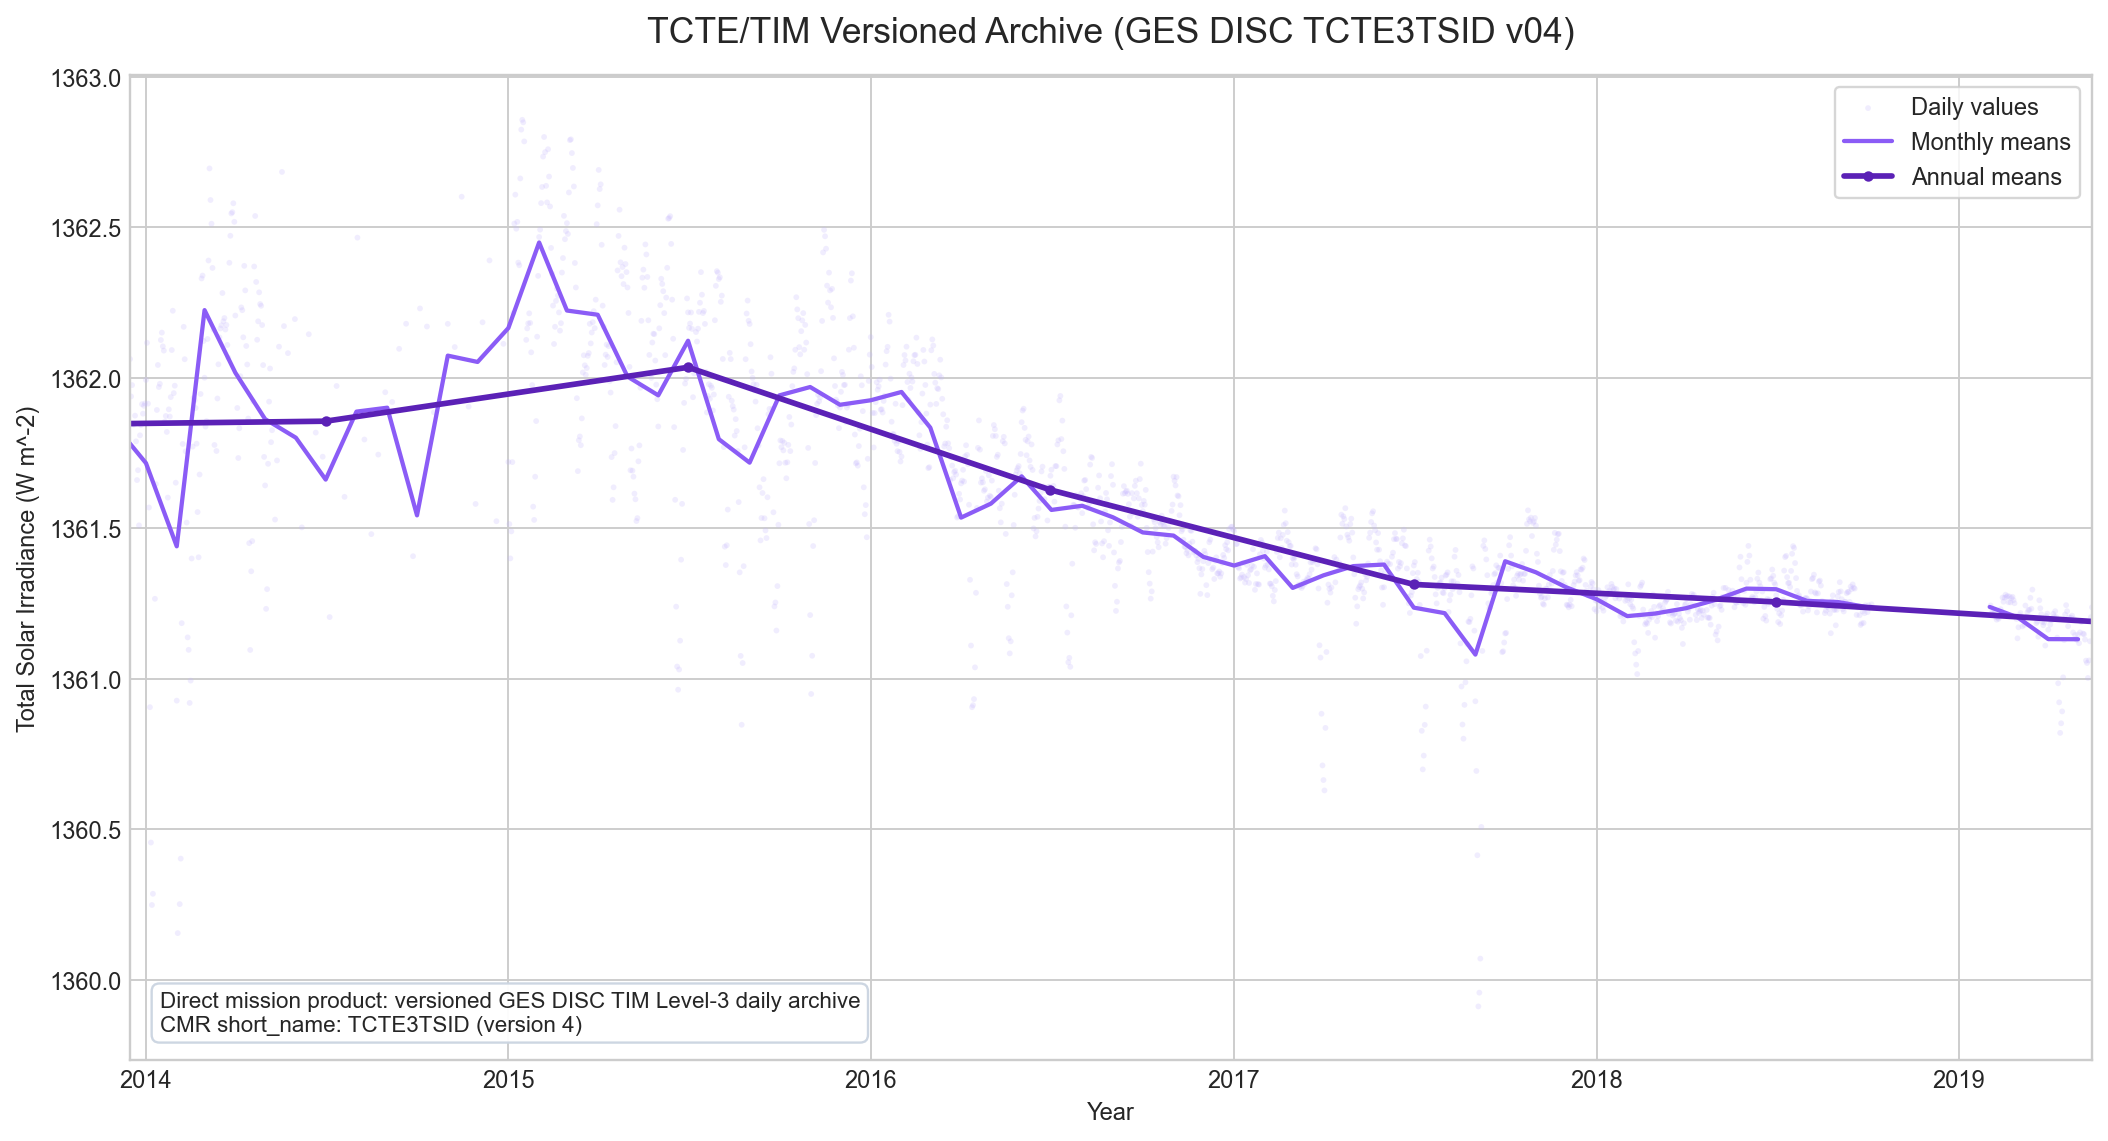
Light points: daily mission values. Purple line: monthly means. Dark line/markers: annual means. Date span shown: 2013-12-16 to 2019-05-15.
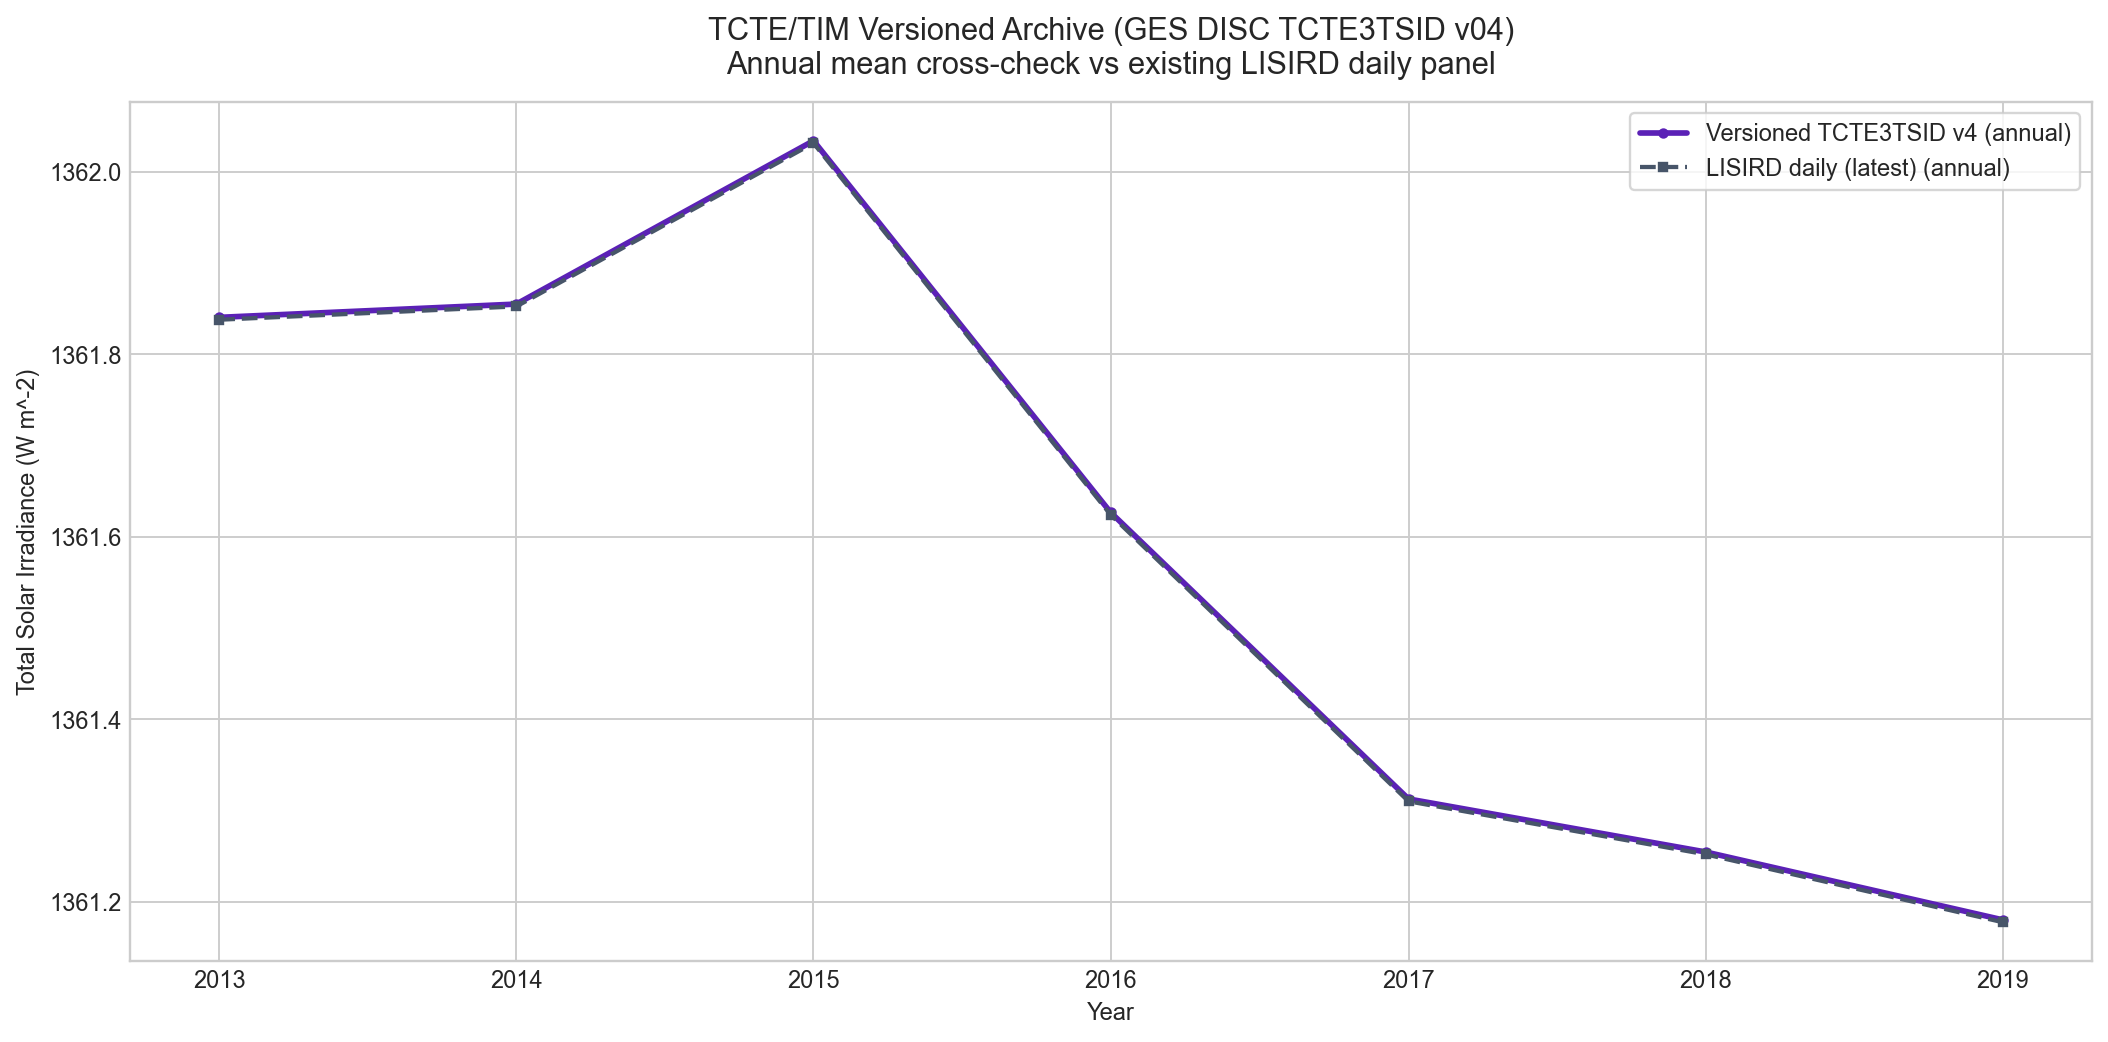
Cross-check: annual means from the versioned TCTE3TSID v04 archive (solid) against the existing LISIRD daily TCTE feed (dashed).
TSIS-1/TIM Versioned Archive (GES DISC TSIS_TSI_L3_24HR v05)
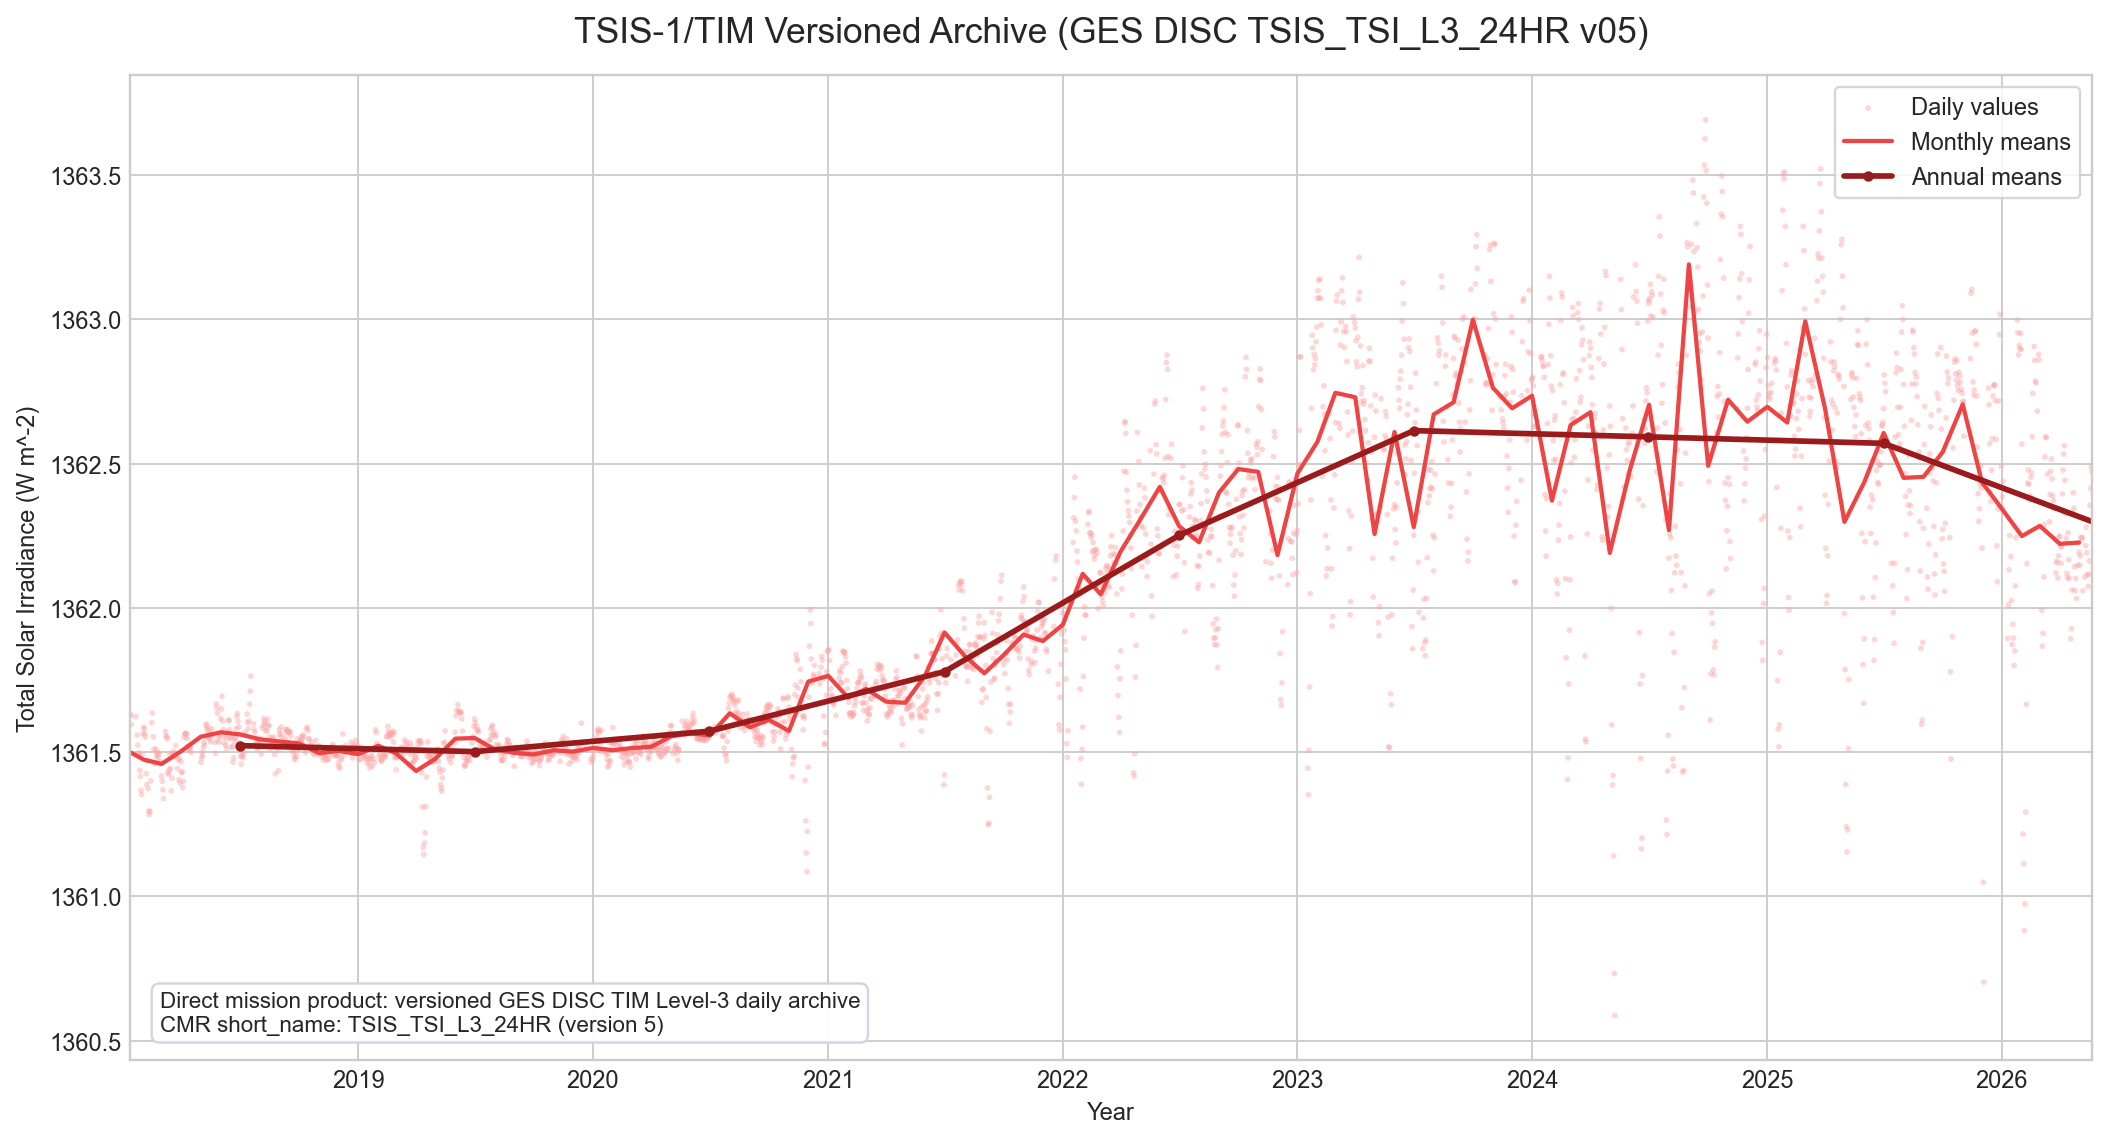
Light points: daily mission values. Red line: monthly means. Dark line/markers: annual means. Date span shown: 2018-01-11 to 2026-05-21.
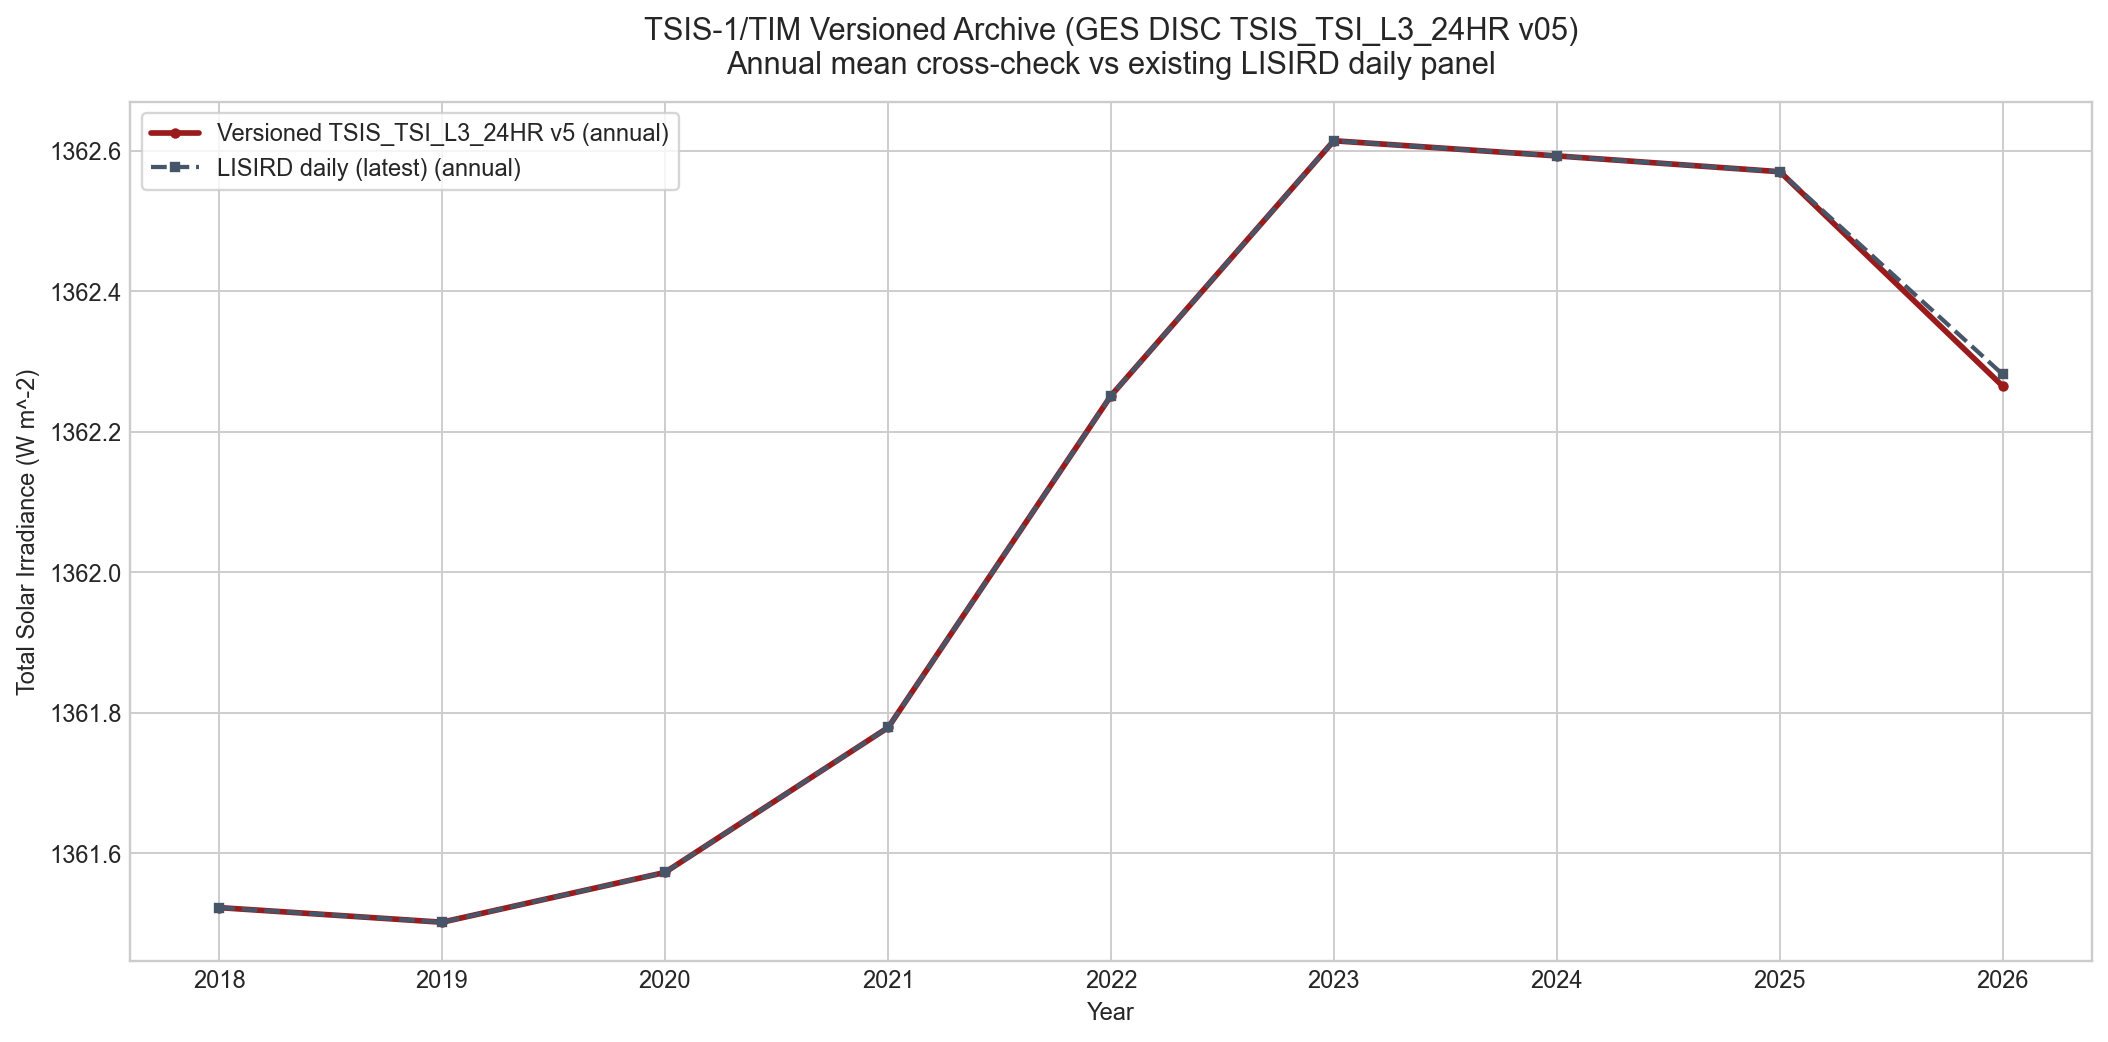
Cross-check: annual means from the versioned TSIS_TSI_L3_24HR v05 archive (solid) against the existing LISIRD daily TSIS-1 feed (dashed).
Combined Mission View (SORCE + TCTE + TSIS-1)
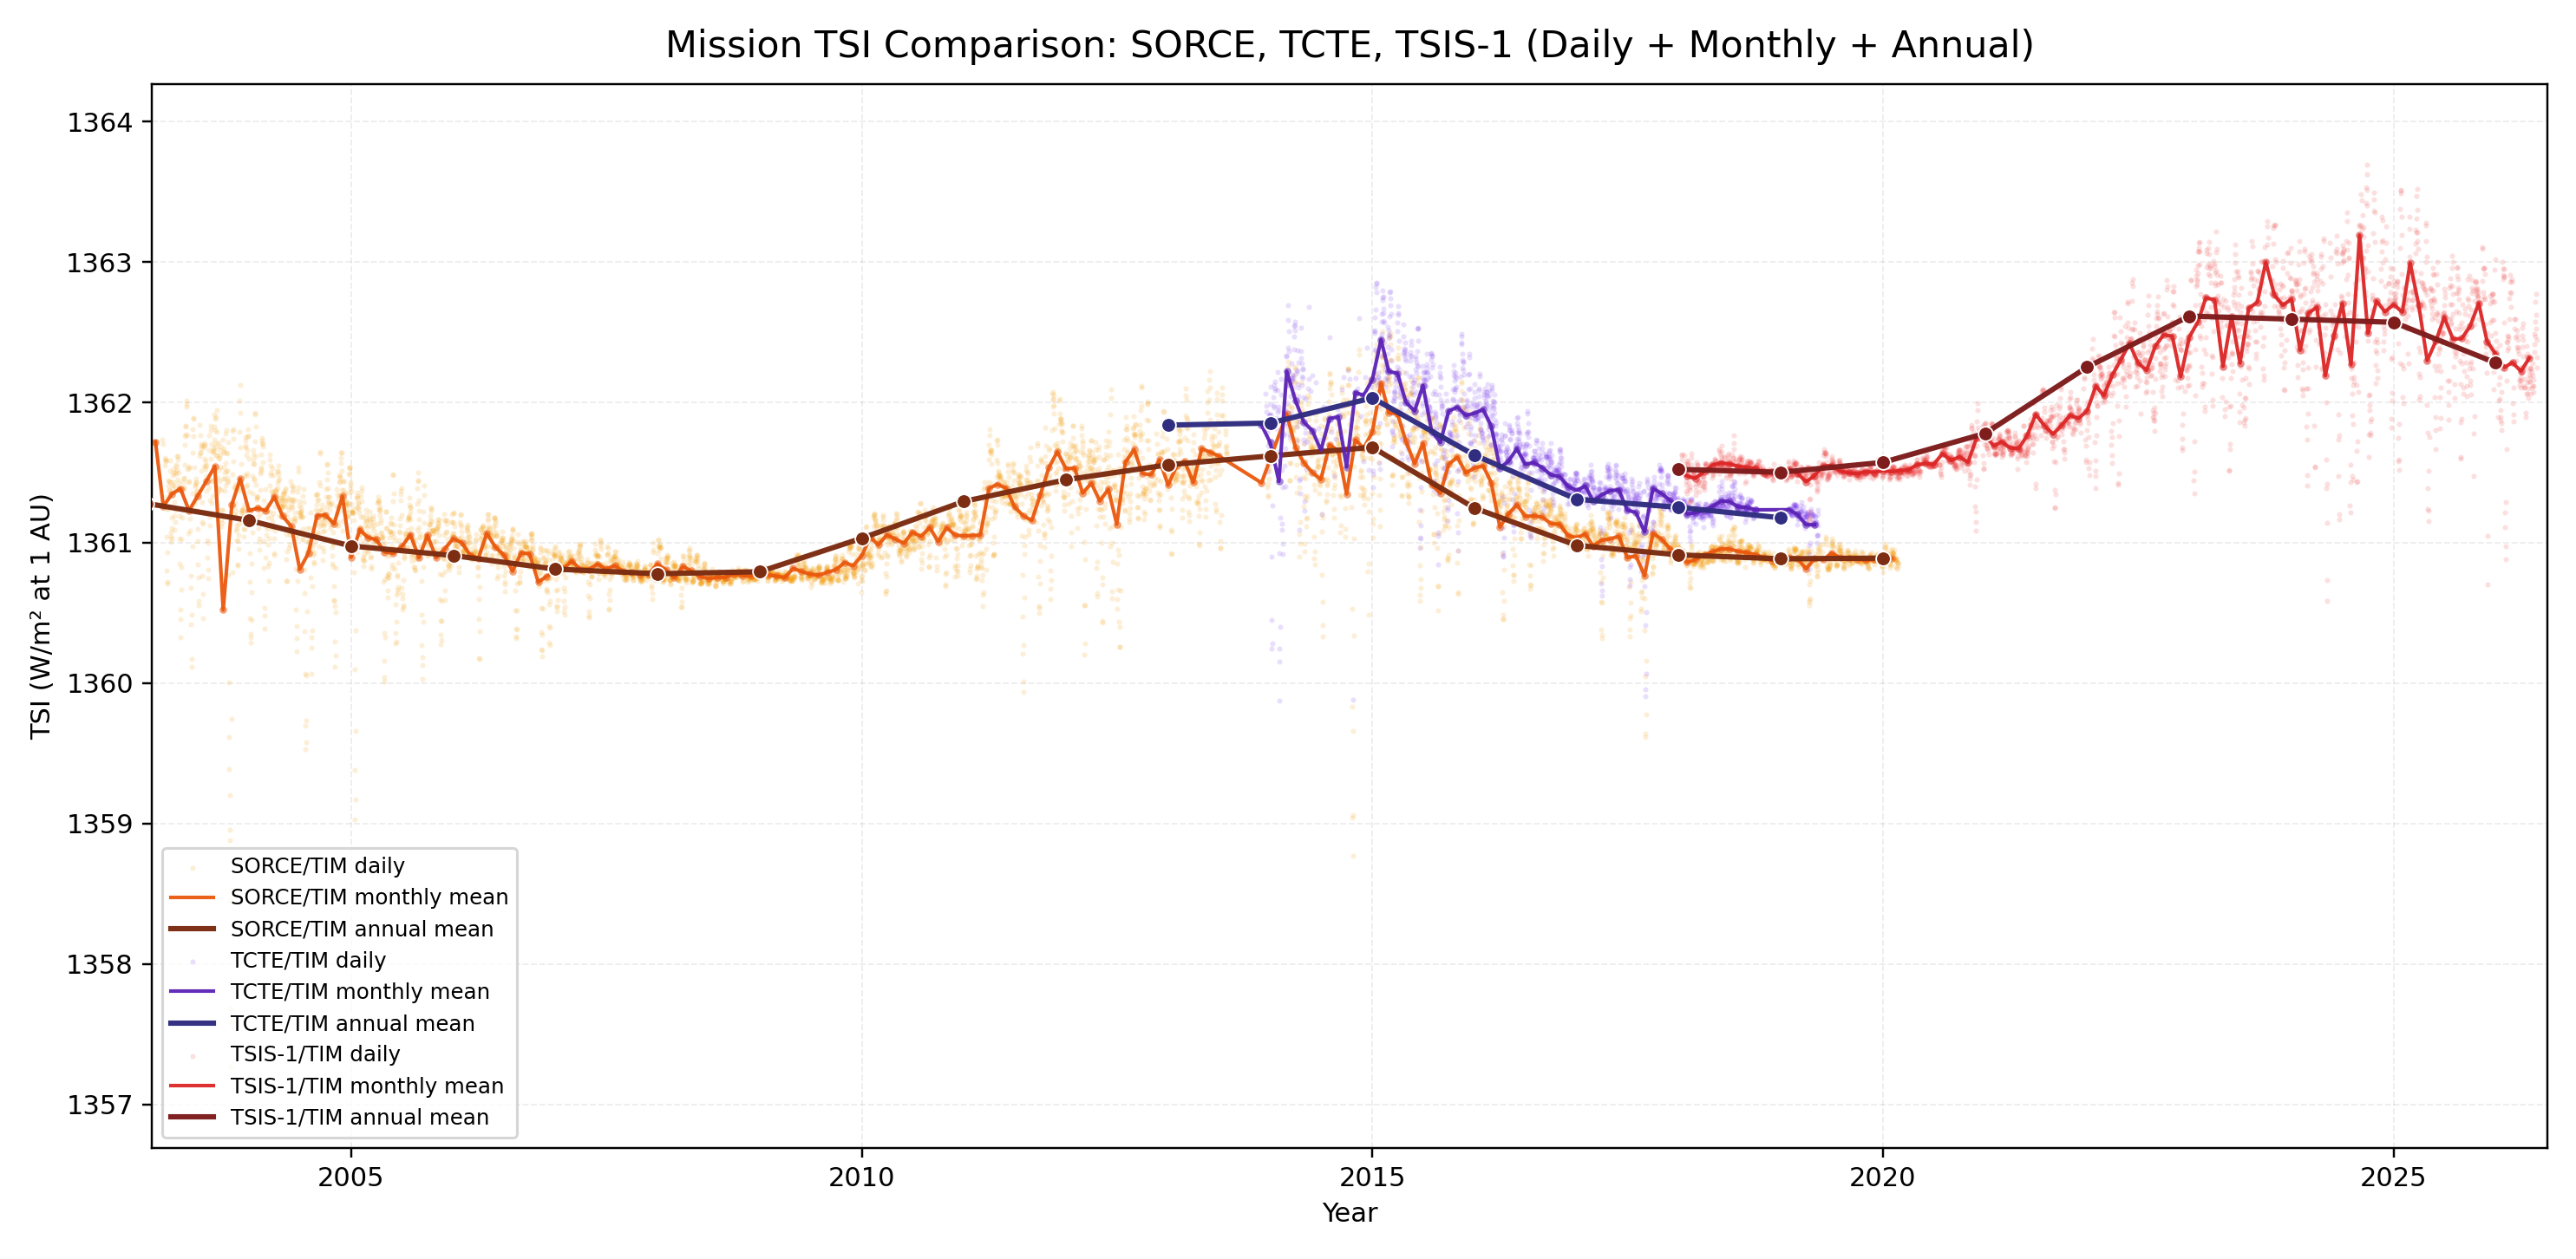
SORCE uses orange tones, TCTE uses purple tones, TSIS-1 uses red tones. Within each theme: light points = daily, medium line = monthly mean, dark line/markers = annual mean.
ACRIM Composite TSI — ACRIM Science Team / NOAA NGDC
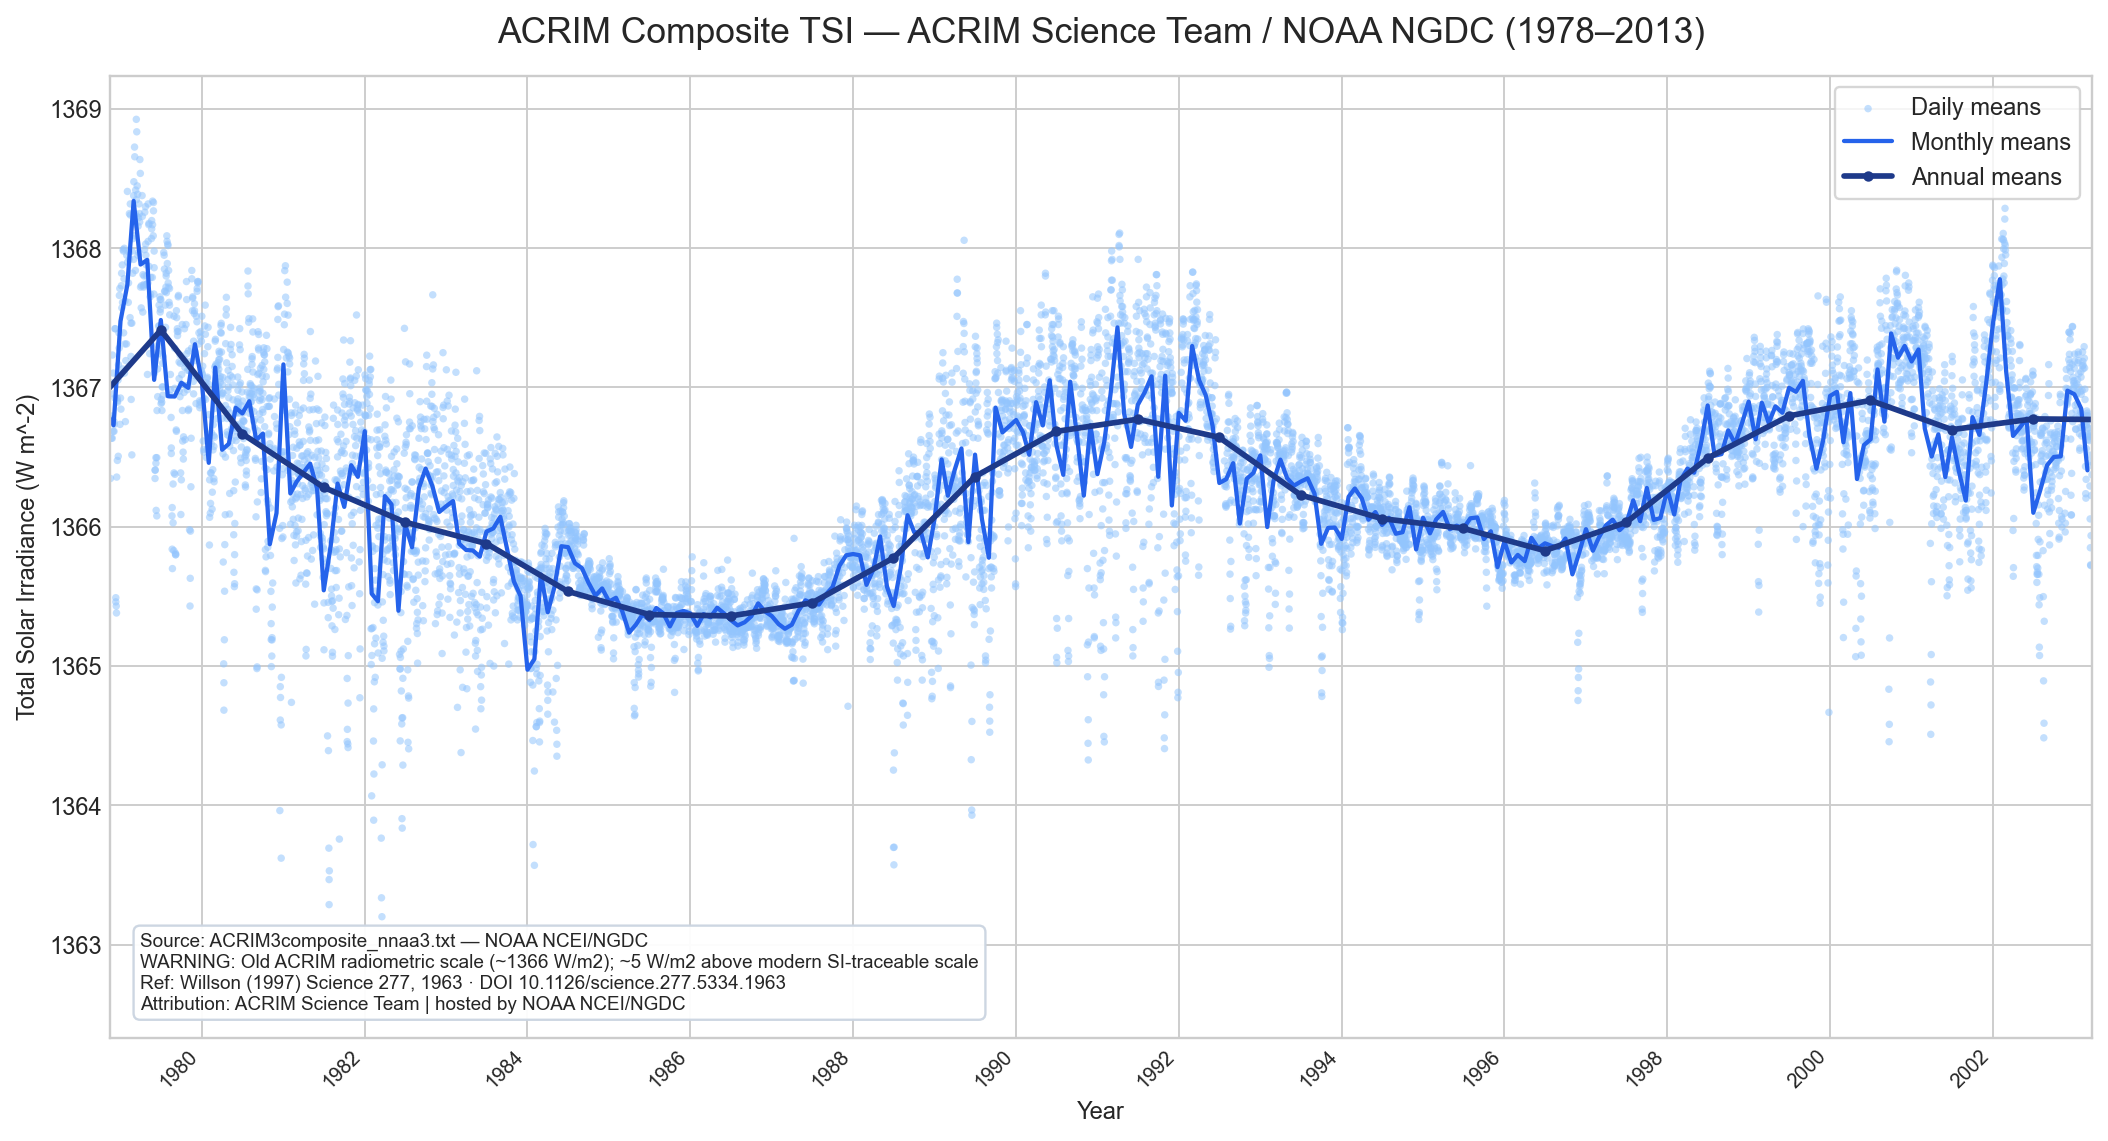
Blue points: daily values. Blue line: monthly means. Dark blue line/markers: annual means. Date span: 1978–2013 (8,348 daily rows). Note: plotted on old ACRIM scale (~1366 W/m²), ~5 W/m² above modern SI-traceable values.
IRMB/C3S Composite TSI v3.1 — RMIB / Copernicus C3S
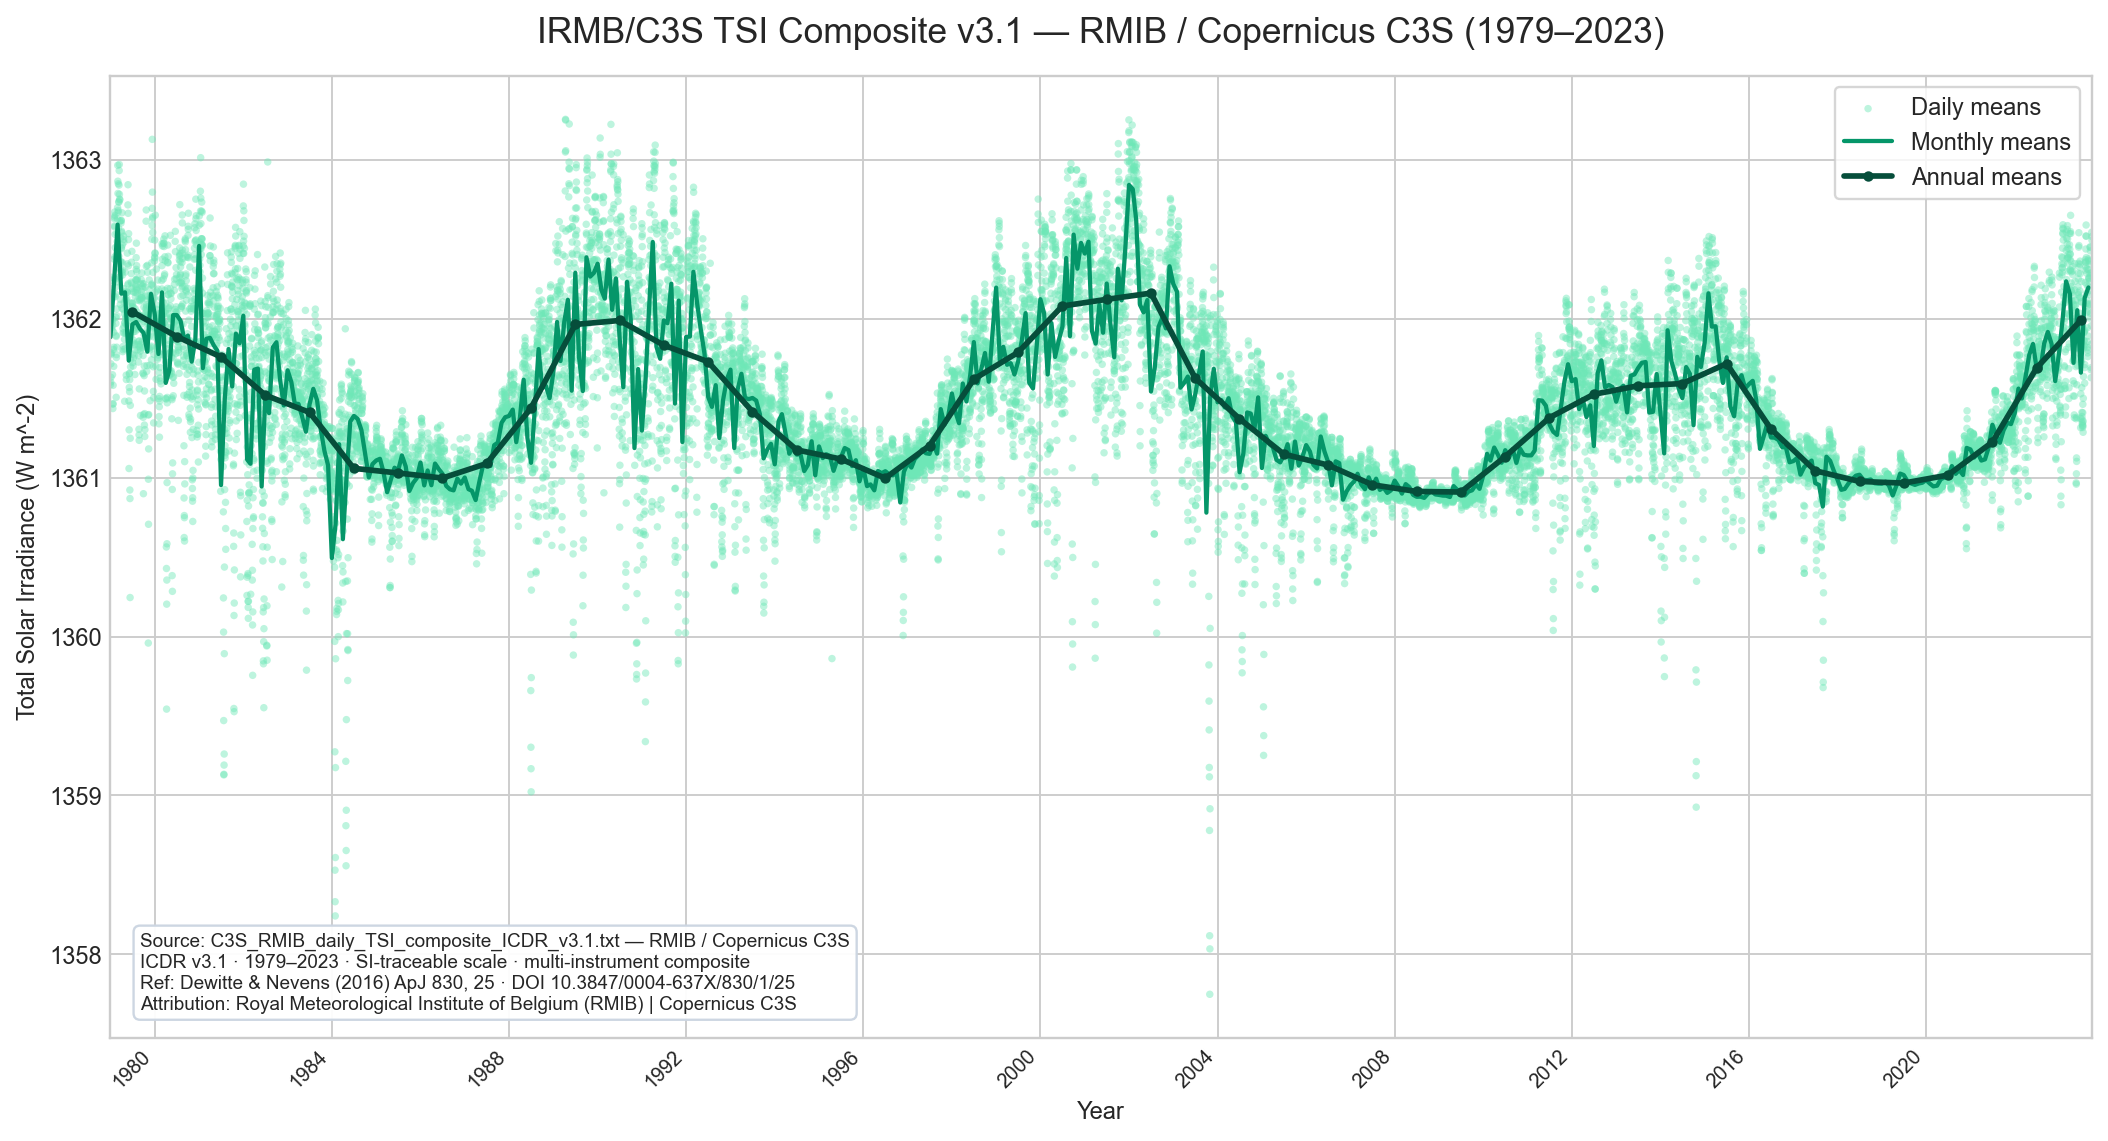
Green points: daily values. Green line: monthly means. Dark green line/markers: annual means. Date span: 1979–2023 (16,341 daily rows). SI-traceable scale; multi-instrument composite combining 12 space instruments.
PMOD Composite TSI Data Fusion (July 2025 update)
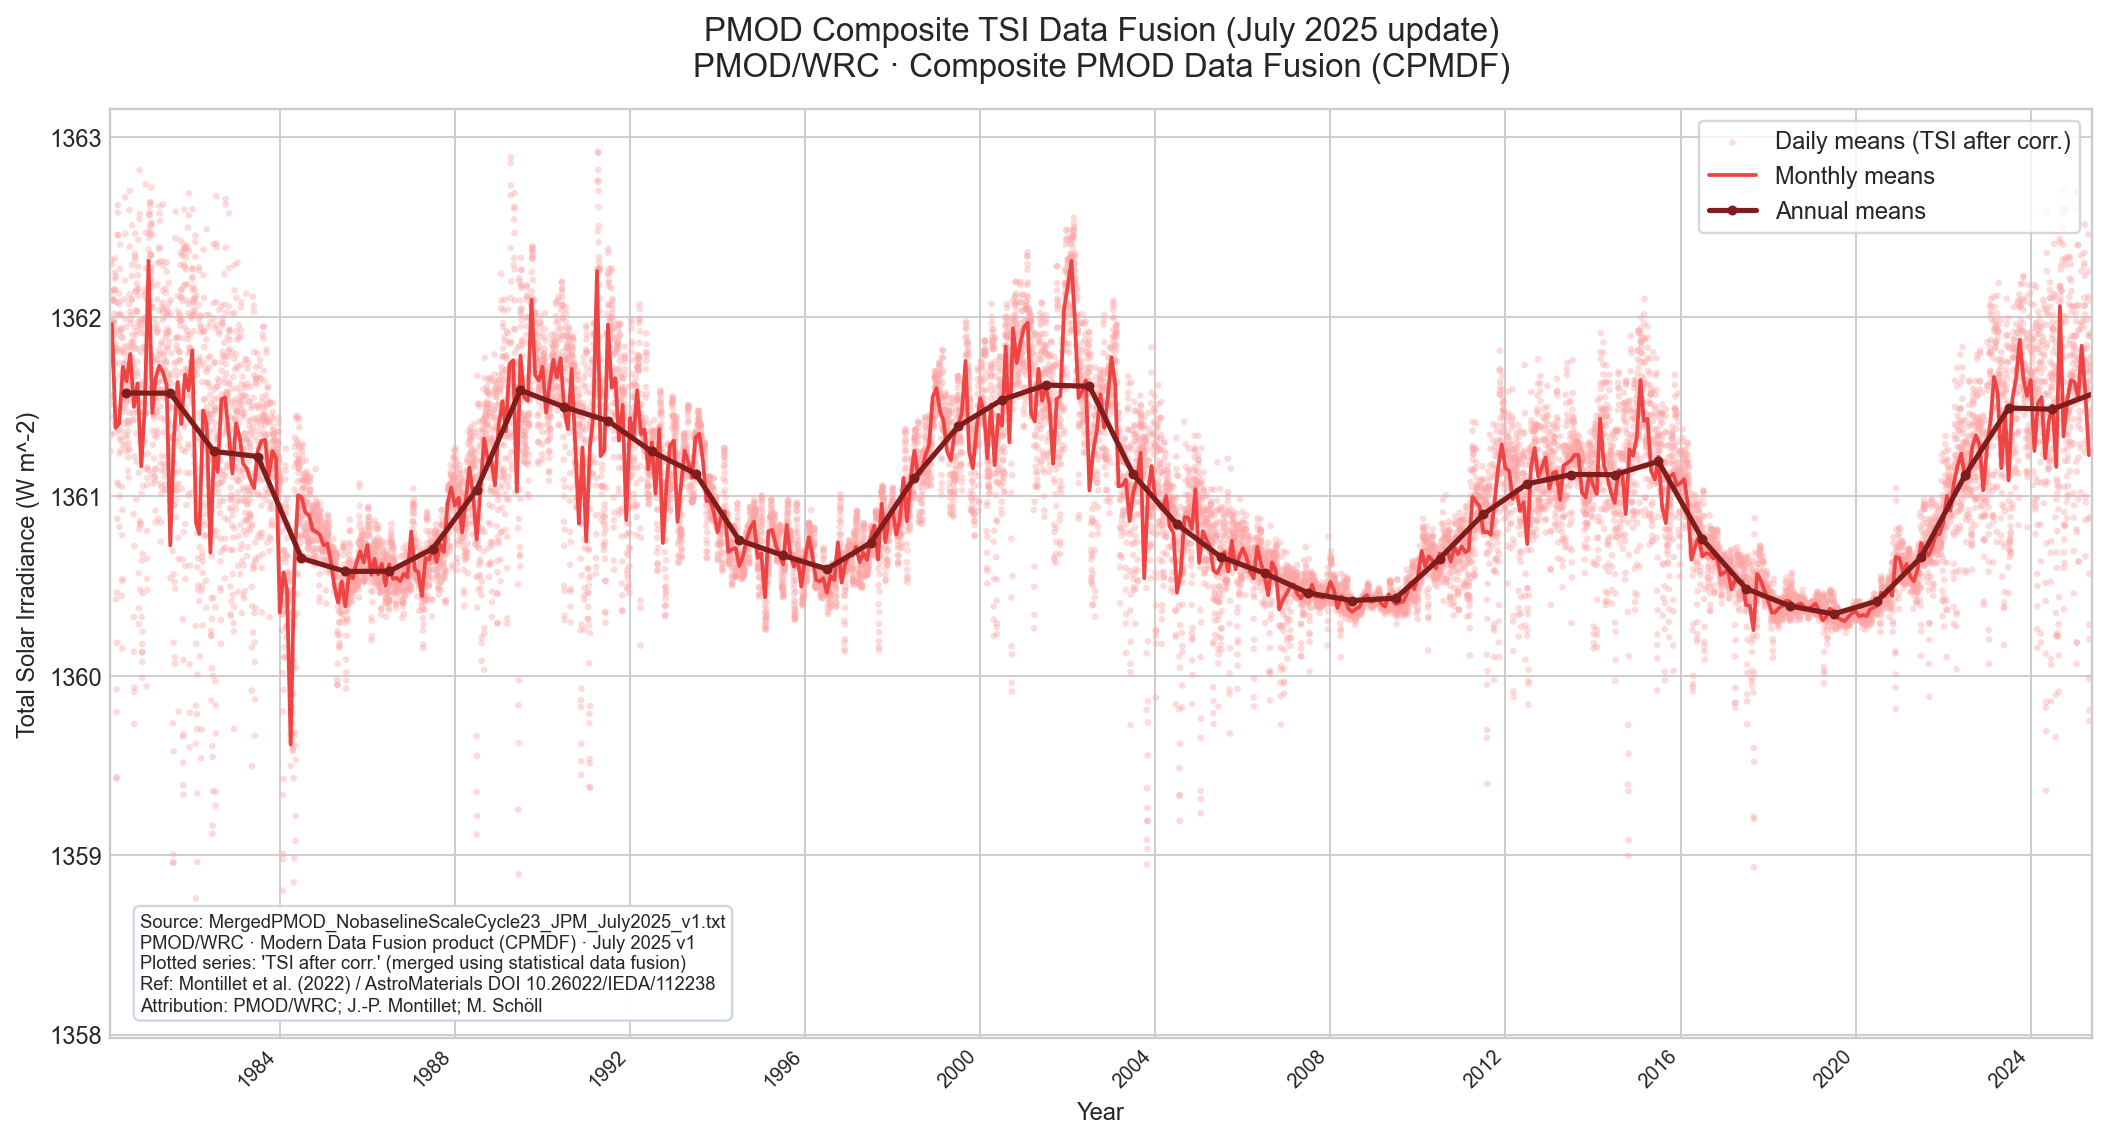
Red points: daily values (TSI after corr.). Red line: monthly means. Dark red line/markers: annual means. Date span: 1980\u20132025 (16,528 daily rows). SI-traceable scale. Modern PMOD data fusion product merging multiple satellite records.
ISSI/Dudok de Wit TSI Composite v1.1 (TSIc, PMOD-style corrected)
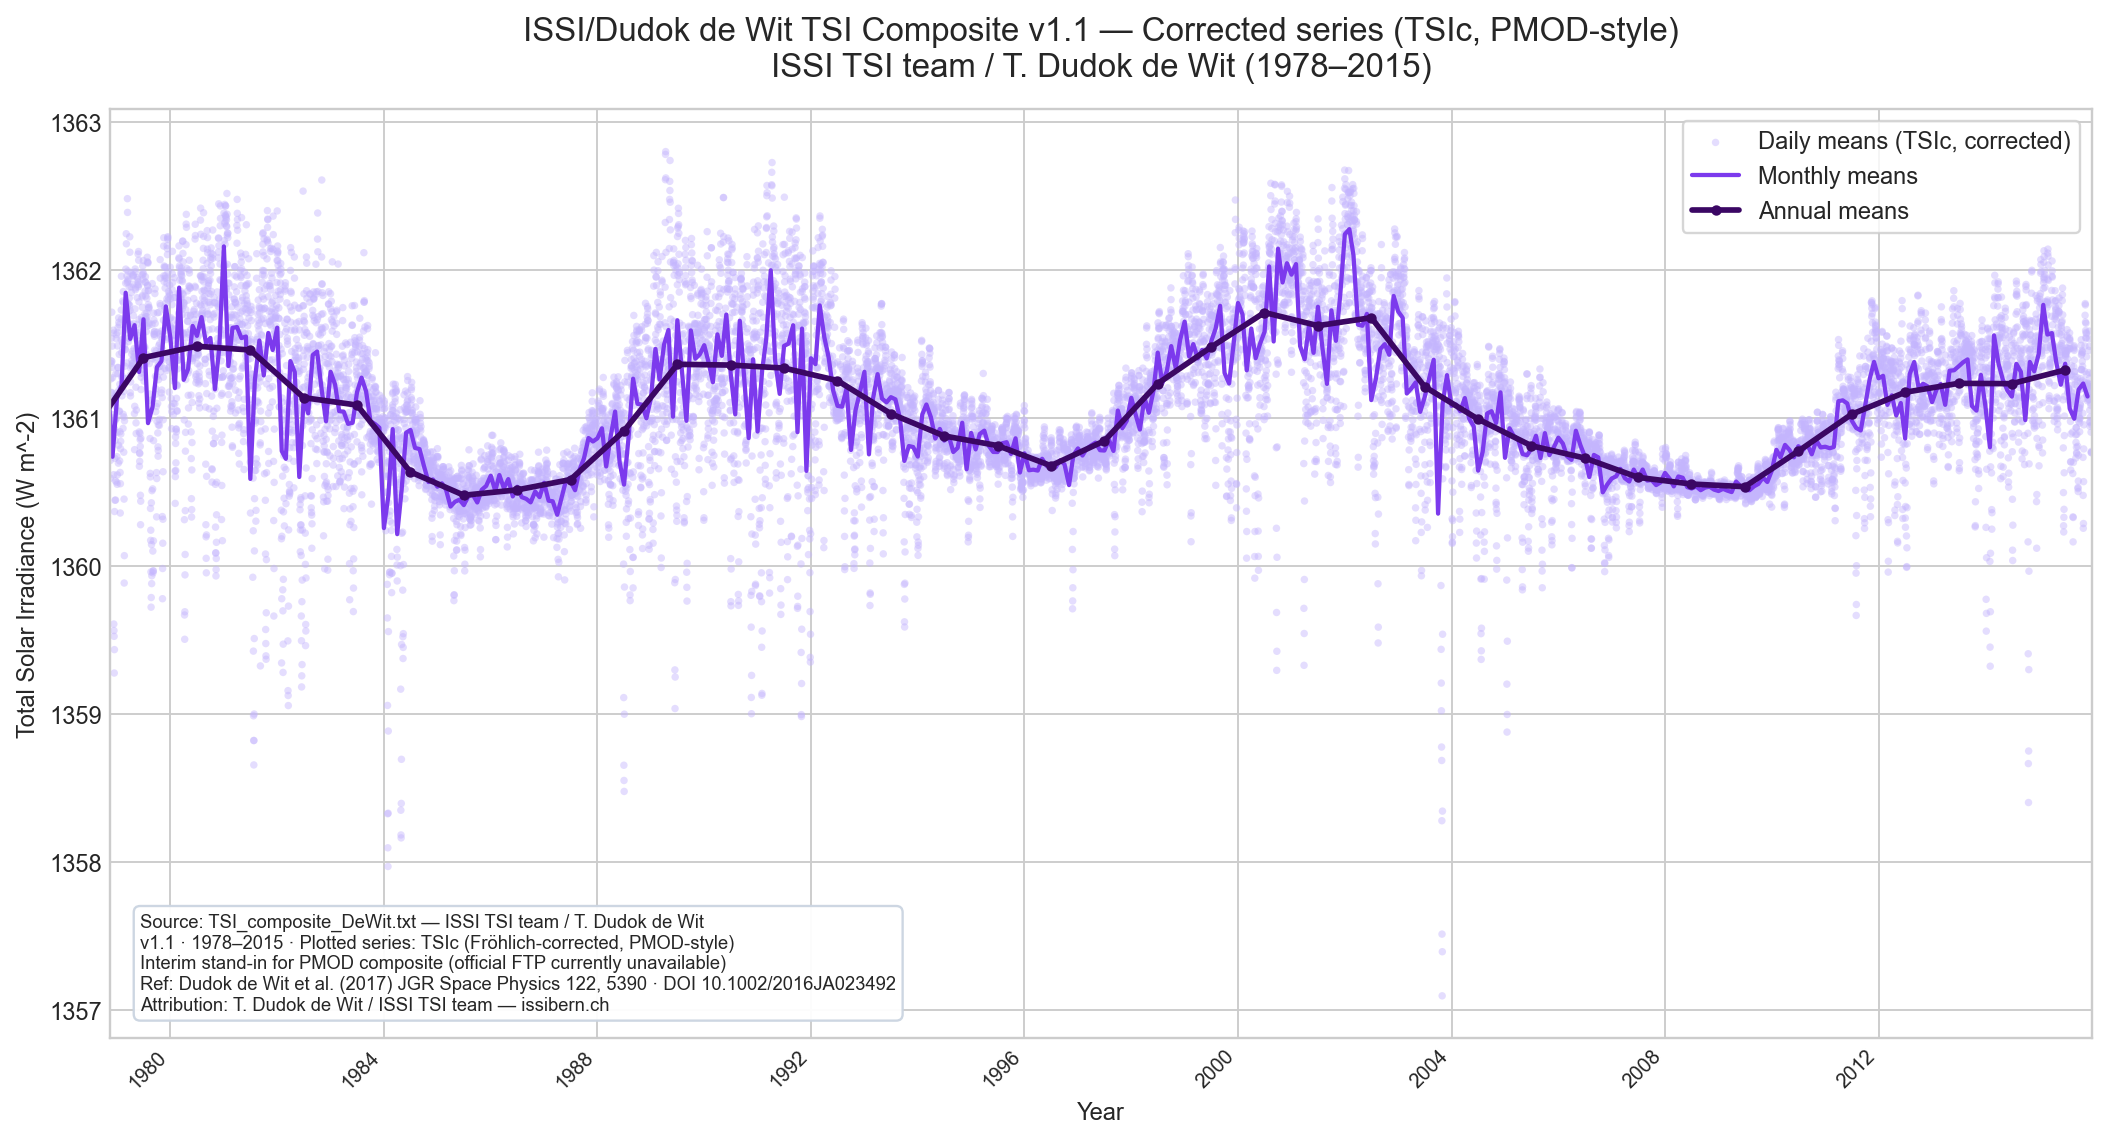
Purple points: daily values (TSIc, corrected). Purple line: monthly means. Dark purple line/markers: annual means. Date span: 1978\u20132015 (13,559 daily rows). SI-traceable scale. This composite uses a blind source separation technique to estimate the solar signal from multiple instrument feeds.
SATIRE-S TSI Reconstruction (latest, version 20260521)
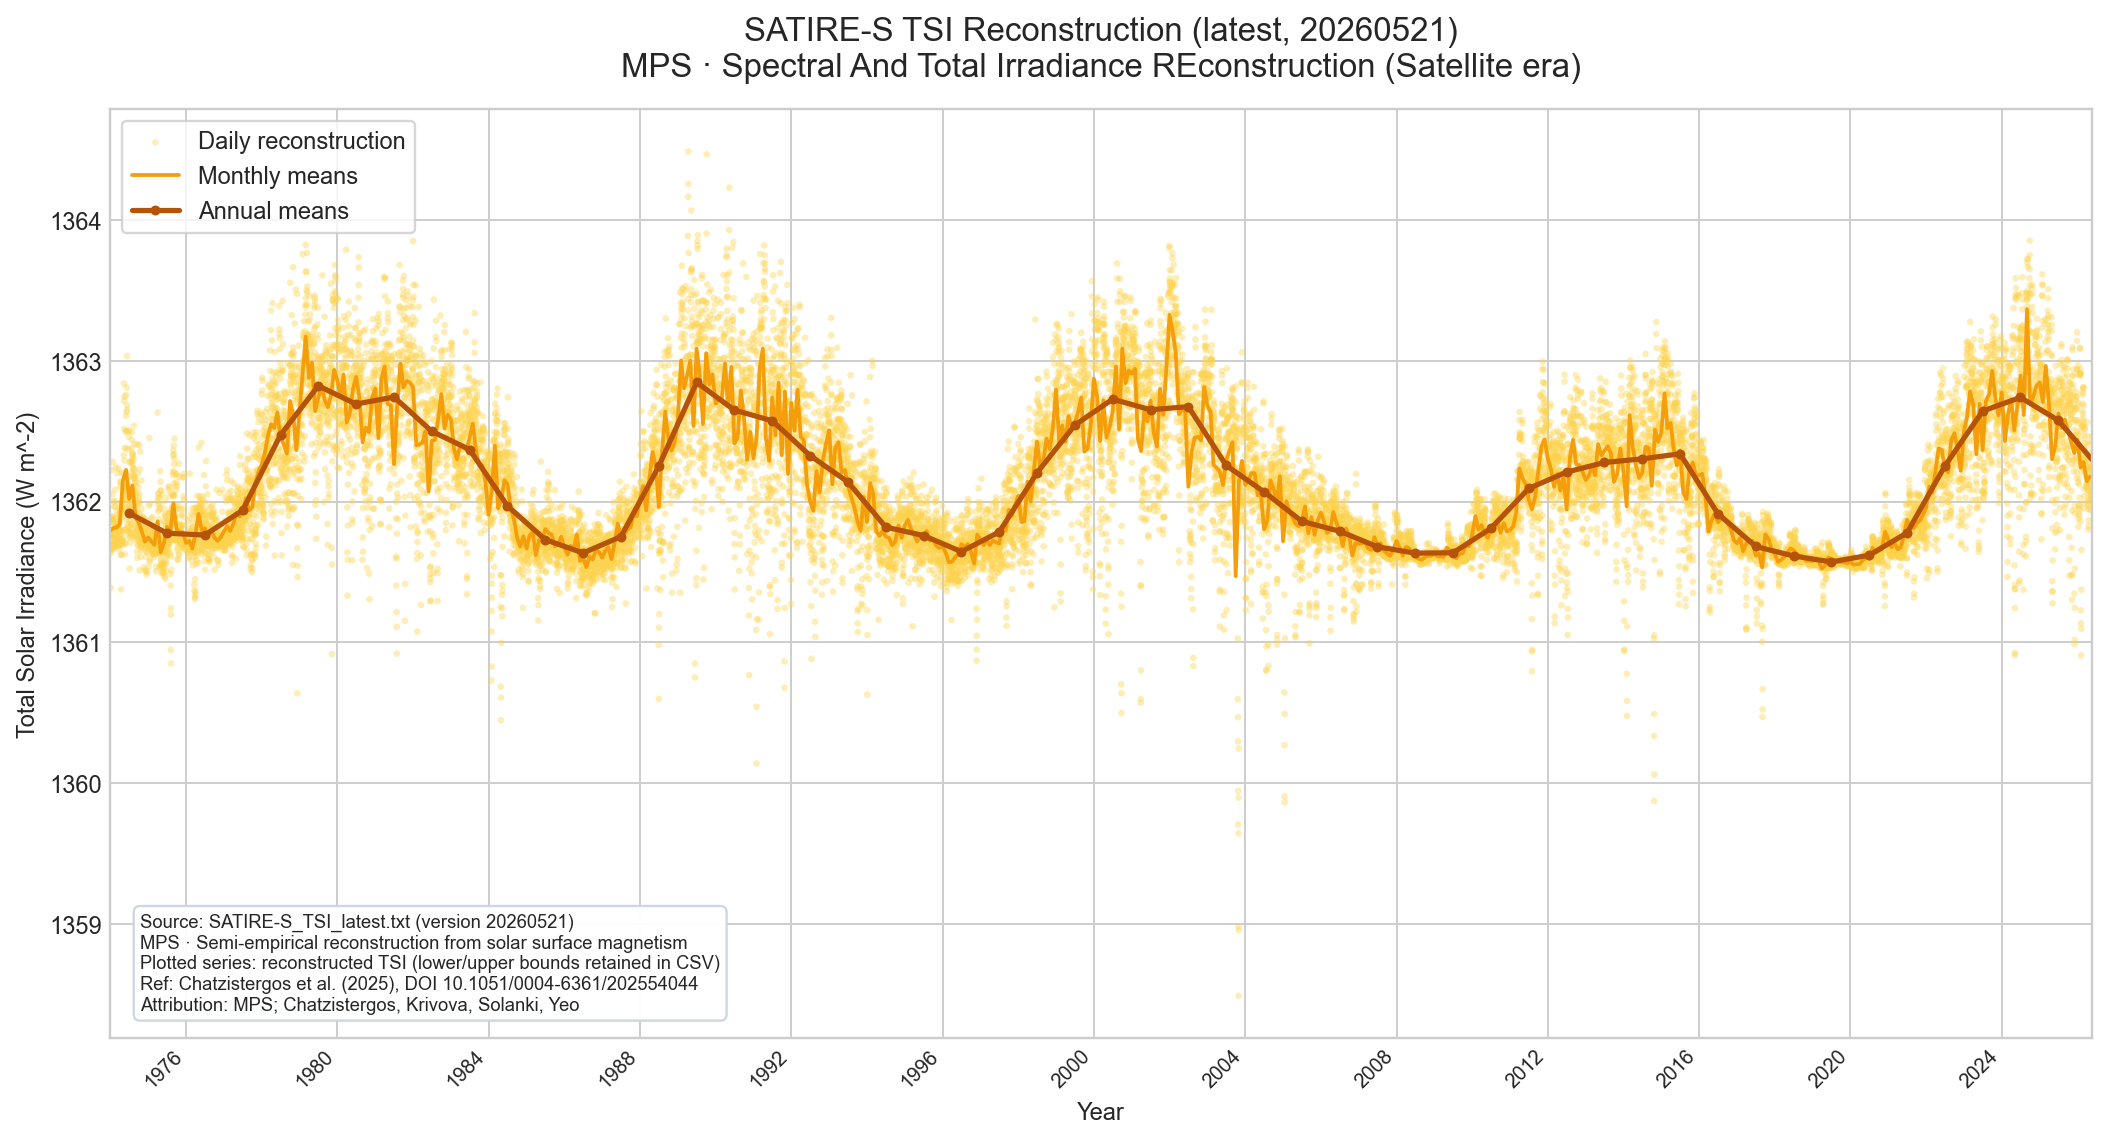
Amber points: daily reconstruction. Orange line: monthly means. Dark orange line/markers: annual means. Date span: 1974–2026 (19,134 daily rows). SI-traceable scale. SATIRE-S models irradiance variations from solar surface magnetism, using magnetograms (KPVT, SoHO/MDI, SDO/HMI) and Ca II K data as inputs.
SMM.PLT file (1980–1989); note the old SMM absolute scale is ~6–7 W/m² above modern TIM values.
PICARD/PREMOS here is plotted from mission FITS granules discovered via the idoc-picard records API and reduced to daily values.
PICARD/SOVAP is the Meftah et al. (2016) composite from CDS VizieR VI/152, independent of the PREMOS instrument panel.
The ACRIM composite (Willson 1997) is an expert-merged product spanning ACRIM I\u2013III (1978\u20132013); note its old radiometric scale is ~5 W/m\u00b2 higher than modern SI-traceable values.
The IRMB/C3S composite (Dewitte & Nevens 2016) is a Copernicus C3S climate data record merging 12 instruments on the SI-traceable scale (1979\u20132023).
The PMOD composite (July 2025 update) is the modern PMOD/WRC Data Fusion product (CPMDF), merging multiple satellite records using advanced statistical methods.
The ISSI/Dudok de Wit composite (v1.1, 1978\u20132015) is plotted using the TSIc (Fr\u00f6hlich-corrected) series, which applies the same instrument corrections used in the official PMOD composite.
Both TSIc and the uncorrected TSIo series are retained in the exported CSV.
The SATIRE-S reconstruction (Chatzistergos et al. 2025, 1974\u20132026) is a semi-empirical model that derives TSI from solar surface magnetism rather than from merged radiometer measurements, so it provides an independent modelled cross-check against the benchmark composites.
Lean (2015), SIST, both NOAA daily CDR panels, and the Kopp historical series are composite/reconstruction products.
The pre-SORCE individual mission panel is reserved for raw mission streams only (when available locally).
SORCE, TCTE, and TSIS-1 panels overlay daily, monthly, and annual levels from their filtered daily sources; the NOAA panels also show daily, monthly, and annual values, but from a climate data record rather than a single instrument feed.
Source files used
kopp_tsi_reconstruction.txtlean2015_tsi.txtlean2015_extended_with_sist_annual.csvtsi_composite_sist.txtnoaa_tsi_cdr_daily_manifest.txtnoaa_tsi_cdr_daily/pre_sorce_individual_raw/nimbus7_tsi_19781116_19931213build_pre_sorce_individual_missions_chart.pypre_sorce_individual_raw/build_lisird_nn_sim_tsi_chart.pynn_sim_tsi.nctsi_satellite_sources/nn_sim_tsi_daily_monthly_annual.pngtsi_satellite_sources/nn_sim_tsi_daily.csvtsi_satellite_sources/nn_sim_tsi_manifest.txtbuild_lisird_sorce_tsi_chart.pylisird_sorce_tsi_24hr_l3_v20.txttsi_satellite_sources/lisird_sorce_tsi_daily_monthly_annual.pngtsi_satellite_sources/lisird_sorce_tsi_daily.csvtsi_satellite_sources/lisird_sorce_tsi_manifest.txtbuild_lisird_ctim_tsi_chart.pylisird_ctim_tsi_24hr_l3_v1.txttsi_satellite_sources/lisird_ctim_tsi_daily_monthly_annual.pngtsi_satellite_sources/lisird_ctim_tsi_daily.csvtsi_satellite_sources/lisird_ctim_tsi_manifest.txtbuild_erbe_tsi_erbs_nat_chart.pytsi_raw/erbs_erbe/raw/tsi_erbs_8410_0303tsi_raw/erbs_erbe/source.txttsi_satellite_sources/erbe_tsi_erbs_nat_daily_monthly_annual.pngtsi_satellite_sources/erbe_tsi_erbs_nat_orbital_observations.csvtsi_satellite_sources/erbe_tsi_erbs_nat_manifest.txtbuild_acrim2_tsi_uars_nat_chart.pytsi_raw/acrim2_uars_nat/raw/acrim2_tsi_uars_nat_1tsi_raw/acrim2_uars_nat/source.txttsi_satellite_sources/acrim2_tsi_uars_nat_daily_monthly_annual.pngtsi_satellite_sources/acrim2_tsi_uars_nat_daily.csvtsi_satellite_sources/acrim2_tsi_uars_nat_manifest.txtbuild_acrim3_l2_daily_mean_chart.pytsi_raw/acrim3_l2_daily_mean/raw/tsi_raw/acrim3_l2_daily_mean/source.txttsi_satellite_sources/acrim3_l2_daily_mean_daily_monthly_annual.pngtsi_satellite_sources/acrim3_l2_daily_mean_daily.csvtsi_satellite_sources/acrim3_l2_daily_mean_manifest.txtbuild_acrim3_l2_shutter_cycle_chart.pytsi_raw/acrim3_l2_shutter_cycle/raw/tsi_raw/acrim3_l2_shutter_cycle/source.txttsi_satellite_sources/acrim3_l2_shutter_cycle_daily_monthly_annual.pngtsi_satellite_sources/acrim3_l2_shutter_cycle_daily.csvtsi_satellite_sources/acrim3_l2_shutter_cycle_manifest.txtbuild_soho_virgo_tsi_chart.pytsi_raw/soho_virgo/raw/virgo_tsi_d_v1_2.dattsi_raw/soho_virgo/source.txttsi_satellite_sources/soho_virgo_tsi_daily_monthly_annual.pngtsi_satellite_sources/soho_virgo_tsi_daily.csvtsi_satellite_sources/soho_virgo_tsi_manifest.txtbuild_picard_premos_tsi_chart.pytsi_raw/picard_premos/raw/tsi_raw/picard_premos/source.txttsi_satellite_sources/picard_premos_tsi_daily_monthly_annual.pngtsi_satellite_sources/picard_premos_tsi_daily.csvtsi_satellite_sources/picard_premos_tsi_manifest.txtbuild_soho_virgo_v8_tsi_chart.pytsi_raw/soho_virgo_v8/raw/VIRGO_TSI_daily_V8.txttsi_raw/soho_virgo_v8/source.txttsi_satellite_sources/soho_virgo_v8_tsi_daily_monthly_annual.pngtsi_satellite_sources/soho_virgo_v8_tsi_daily.csvtsi_satellite_sources/soho_virgo_v8_tsi_manifest.txtbuild_acrim_smm_tsi_chart.pytsi_raw/acrim_smm/raw/SMM.PLTtsi_raw/acrim_smm/source.txttsi_satellite_sources/acrim_smm_tsi_daily_monthly_annual.pngtsi_satellite_sources/acrim_smm_tsi_daily.csvtsi_satellite_sources/acrim_smm_tsi_manifest.txtbuild_picard_sovap_tsi_chart.pytsi_raw/picard_sovap/raw/composit.dattsi_raw/picard_sovap/raw/ReadMetsi_raw/picard_sovap/source.txttsi_satellite_sources/picard_sovap_tsi_daily_monthly_annual.pngtsi_satellite_sources/picard_sovap_tsi_daily.csvtsi_satellite_sources/picard_sovap_tsi_manifest.txttsi_satellite_sources/pre_sorce_individual_missions_daily_monthly_annual.pngtsi_satellite_sources/pre_sorce_individual_missions_daily.csvtsi_satellite_sources/pre_sorce_individual_missions_manifest.txtbuild_acrim_composite_tsi_chart.pytsi_raw/acrim_composite/raw/ACRIM3composite_nnaa3.txttsi_raw/acrim_composite/source.txttsi_satellite_sources/acrim_composite_tsi_daily_monthly_annual.pngtsi_satellite_sources/acrim_composite_tsi_daily.csvtsi_satellite_sources/acrim_composite_tsi_manifest.txtbuild_irmb_composite_tsi_chart.pytsi_raw/irmb_composite/raw/C3S_RMIB_daily_TSI_composite_ICDR_v3.1.txttsi_raw/irmb_composite/source.txttsi_satellite_sources/irmb_composite_tsi_daily_monthly_annual.pngtsi_satellite_sources/irmb_composite_tsi_daily.csvtsi_satellite_sources/irmb_composite_tsi_manifest.txtbuild_issi_dewit_composite_tsi_chart.pytsi_raw/issi_dewit_composite/raw/TSI_composite_DeWit.txttsi_raw/issi_dewit_composite/source.txttsi_satellite_sources/issi_dewit_composite_tsi_daily_monthly_annual.pngtsi_satellite_sources/issi_dewit_composite_tsi_daily.csvtsi_satellite_sources/issi_dewit_composite_tsi_manifest.txtbuild_pmod_composite_tsi_chart.pytsi_raw/pmod_composite/raw/MergedPMOD_NobaselineScaleCycle23_JPM_July2025_v1.txttsi_raw/pmod_composite/source.txttsi_satellite_sources/pmod_composite_tsi_daily_monthly_annual.pngtsi_satellite_sources/pmod_composite_tsi_daily.csvtsi_satellite_sources/pmod_composite_tsi_manifest.txtbuild_satire_s_tsi_chart.pytsi_raw/satire_s/raw/SATIRE-S_TSI_latest.txttsi_raw/satire_s/source.txttsi_satellite_sources/satire_s_tsi_daily_monthly_annual.pngtsi_satellite_sources/satire_s_tsi_daily.csvtsi_satellite_sources/satire_s_tsi_manifest.txtsorce_tsi_L3_c24h_latest.txttcte_tsi_L3_c24h_latest.txttsis_tsi_L3_c24h_latest.txtbuild_versioned_tim_tsi_charts.pytsi_raw/versioned_tim_archives/source.txttsi_raw/versioned_tim_archives/SOR3TSID/sorce_tsi_L3_c24h_m29_v19_20030225_20200225.txttsi_raw/versioned_tim_archives/TCTE3TSID/tcte_tsi_L3_c24h_m67_v04_20131213_20190515.txttsi_raw/versioned_tim_archives/TSIS_TSI_L3_24HR/tsis_tsi_L3_c24h_v05_20180110_20260521.txttsi_satellite_sources/versioned_sorce_tim_daily_monthly_annual.pngtsi_satellite_sources/versioned_sorce_tim_vs_latest.pngtsi_satellite_sources/versioned_sorce_tim_daily.csvtsi_satellite_sources/versioned_sorce_tim_manifest.txttsi_satellite_sources/versioned_tcte_tim_daily_monthly_annual.pngtsi_satellite_sources/versioned_tcte_tim_vs_latest.pngtsi_satellite_sources/versioned_tcte_tim_daily.csvtsi_satellite_sources/versioned_tcte_tim_manifest.txttsi_satellite_sources/versioned_tsis_tim_daily_monthly_annual.pngtsi_satellite_sources/versioned_tsis_tim_vs_latest.pngtsi_satellite_sources/versioned_tsis_tim_daily.csvtsi_satellite_sources/versioned_tsis_tim_manifest.txtUpstream sources:
Historical reconstruction: LASP Historical TSI Reconstruction
Lean (2015) annual reconstruction: NASA GISS Lean 2015 file
GISS forcing comparison table (used for context above): NASA GISS Fe_H11_1880-2011 (effective forcing)
SIST composite: LASP TSI Composite (SIST)
NOAA TSI climate data record: NOAA Total Solar Irradiance CDR
NOAA daily access directory: NCEI daily TSI files
NIMBUS-7 ERB Ch10C TSI native-format collection: NASA ASDC NIMBUS-7 TSI dataset page
NN-SIM Total Solar Irradiance dataset page: LISIRD NN-SIM TSI
NN-SIM direct netCDF source: LISIRD nn_sim.nc
LISIRD SORCE TSI dataset page: LISIRD SORCE TSI daily
LISIRD SORCE TSI direct source: LASP SORCE TSI L3 c24h latest
LISIRD CTIM TSI dataset page: LISIRD CTIM TSI daily
LISIRD CTIM TSI direct source: LASP CTIM TSI L3 c24h latest
ERBE ASDC collection page: NASA ASDC ERBE_TSI_ERBS_NAT_1
ERBE protected granule URL: ASDC protected ERBE granule
ACRIM II ASDC collection page: NASA ASDC ACRIMII_TSI_UARS_NAT_1
ACRIM II protected granule URL: ASDC protected ACRIM II granule
ACRIM III ASDC collection page: NASA ASDC ACR3L2DM_1
ACRIM III protected granule example: ASDC protected ACRIM III daily granule
ACRIM III shutter-cycle ASDC collection page: NASA ASDC ACR3L2SC_1
ACRIM III shutter-cycle protected granule example: ASDC protected ACR3L2SC resolved granule
SOHO/VIRGO archive root: IAS VIRGO archive
SOHO/VIRGO daily file (v1.2): IAS virgo_tsi_d_v1_2.dat
SOHO/VIRGO V8 full-mission daily (NASA SOHO archive): soho.nascom.nasa.gov — VIRGO_TSI_daily_V8.txt
SOHO/VIRGO V8 ESA COSMOS mirror: ESA COSMOS SOHO mission-long files
VIRGO V8 reference: Finsterle et al. 2021, Sci Rep 11, 7835
ACRIM I / SMM NCEI landing page: NOAA NCEI legacy TSI archive
ACRIM I / SMM source file (Wayback HTTPS copy): Wayback Machine — NGDC SMM.PLT
ACRIM composite (NGDC file): NOAA NGDC ACRIM3composite_nnaa3.txt
ACRIM composite reference: Willson 1997, Science 277, 1963
IRMB/C3S composite (RMIB file): gerb.oma.be — C3S_RMIB_daily_TSI_composite_ICDR_v3.1.txt
IRMB/C3S composite reference: Dewitte & Nevens 2016, ApJ 830, 25
ISSI/Dudok de Wit composite (ISSI TSI team file): issibern.ch — TSI_composite_DeWit.txt
ISSI/Dudok de Wit composite reference: Dudok de Wit et al. 2017, JGR Space Physics 122, 5390
ISSI TSI team page: issibern.ch \u2014 ISSI TSI team
PMOD composite (Data Fusion CPMDF, July 2025 update): GEO Knowledge Hub \u2014 PMOD Data Fusion
PMOD Data Fusion reference: Montillet et al. 2022 (AstroMaterials)
PMOD/WRC TSI composite page: pmodwrc.ch \u2014 TSI composite
SATIRE-S reconstruction (MPS file): www2.mps.mpg.de \u2014 SATIRE-S_TSI_latest.txt
SATIRE-S reference: Chatzistergos et al. 2025, A&A (DOI 10.1051/0004-6361/202554044)
MPS sun-climate SATIRE data page: www2.mps.mpg.de \u2014 sun-climate data
PICARD/SOVAP CDS VizieR catalog: CDS VizieR VI/152 (Meftah et al. 2016)
PICARD/SOVAP composit.dat: CDS VizieR VI/152 — composit.dat
PICARD/SOVAP reference: Meftah et al. 2016, Metrologia 53, 1
PICARD project metadata: idoc-picard project portal
PICARD dataset listing: idoc-picard datasets API
PREMOS N2A records endpoint: idoc-picard premosn2a records API
SORCE/TIM daily: LASP SORCE TSI L3 (24h)
TCTE/TIM daily: LASP TCTE TSI L3 (24h)
TSIS-1/TIM daily: LASP TSIS-1 TSI L3 (24h)
SORCE/TIM versioned archive (SOR3TSID v19): NASA GES DISC SOR3TSID.019
TCTE/TIM versioned archive (TCTE3TSID v04): NASA GES DISC TCTE3TSID.004
TSIS-1/TIM versioned archive (TSIS_TSI_L3_24HR v05): NASA GES DISC TSIS_TSI_L3_24HR.05
LISIRD TSI-only map (for future downloads):
Catalog root: LISIRD Data Catalog
TSI entries identified in catalog views include:
NNLTSI1 Daily / Monthly / Yearly / Preliminary series
EMPIRE Total Solar Irradiance
Historical Total Solar Irradiance Reconstruction
NN-SIM Total Solar Irradiance
SORCE Total Solar Irradiance (Daily / Six Hour)
TCTE Total Solar Irradiance (Daily / Six Hour)
TSIS-1 Total Solar Irradiance (Daily / Six Hour)
CTIM Total Solar Irradiance (Daily / Six Hour)
Yeo Non-Empirical TSI Reconstruction
SSI exclusion note:
Products labeled SSI, SOLSTICE, or SIM (for example UARS/SOLSTICE SSI or TSIS-1 SSI) are spectral irradiance datasets and are not direct TSI records.
All Direct Mission Streams Combined (Unadjusted)
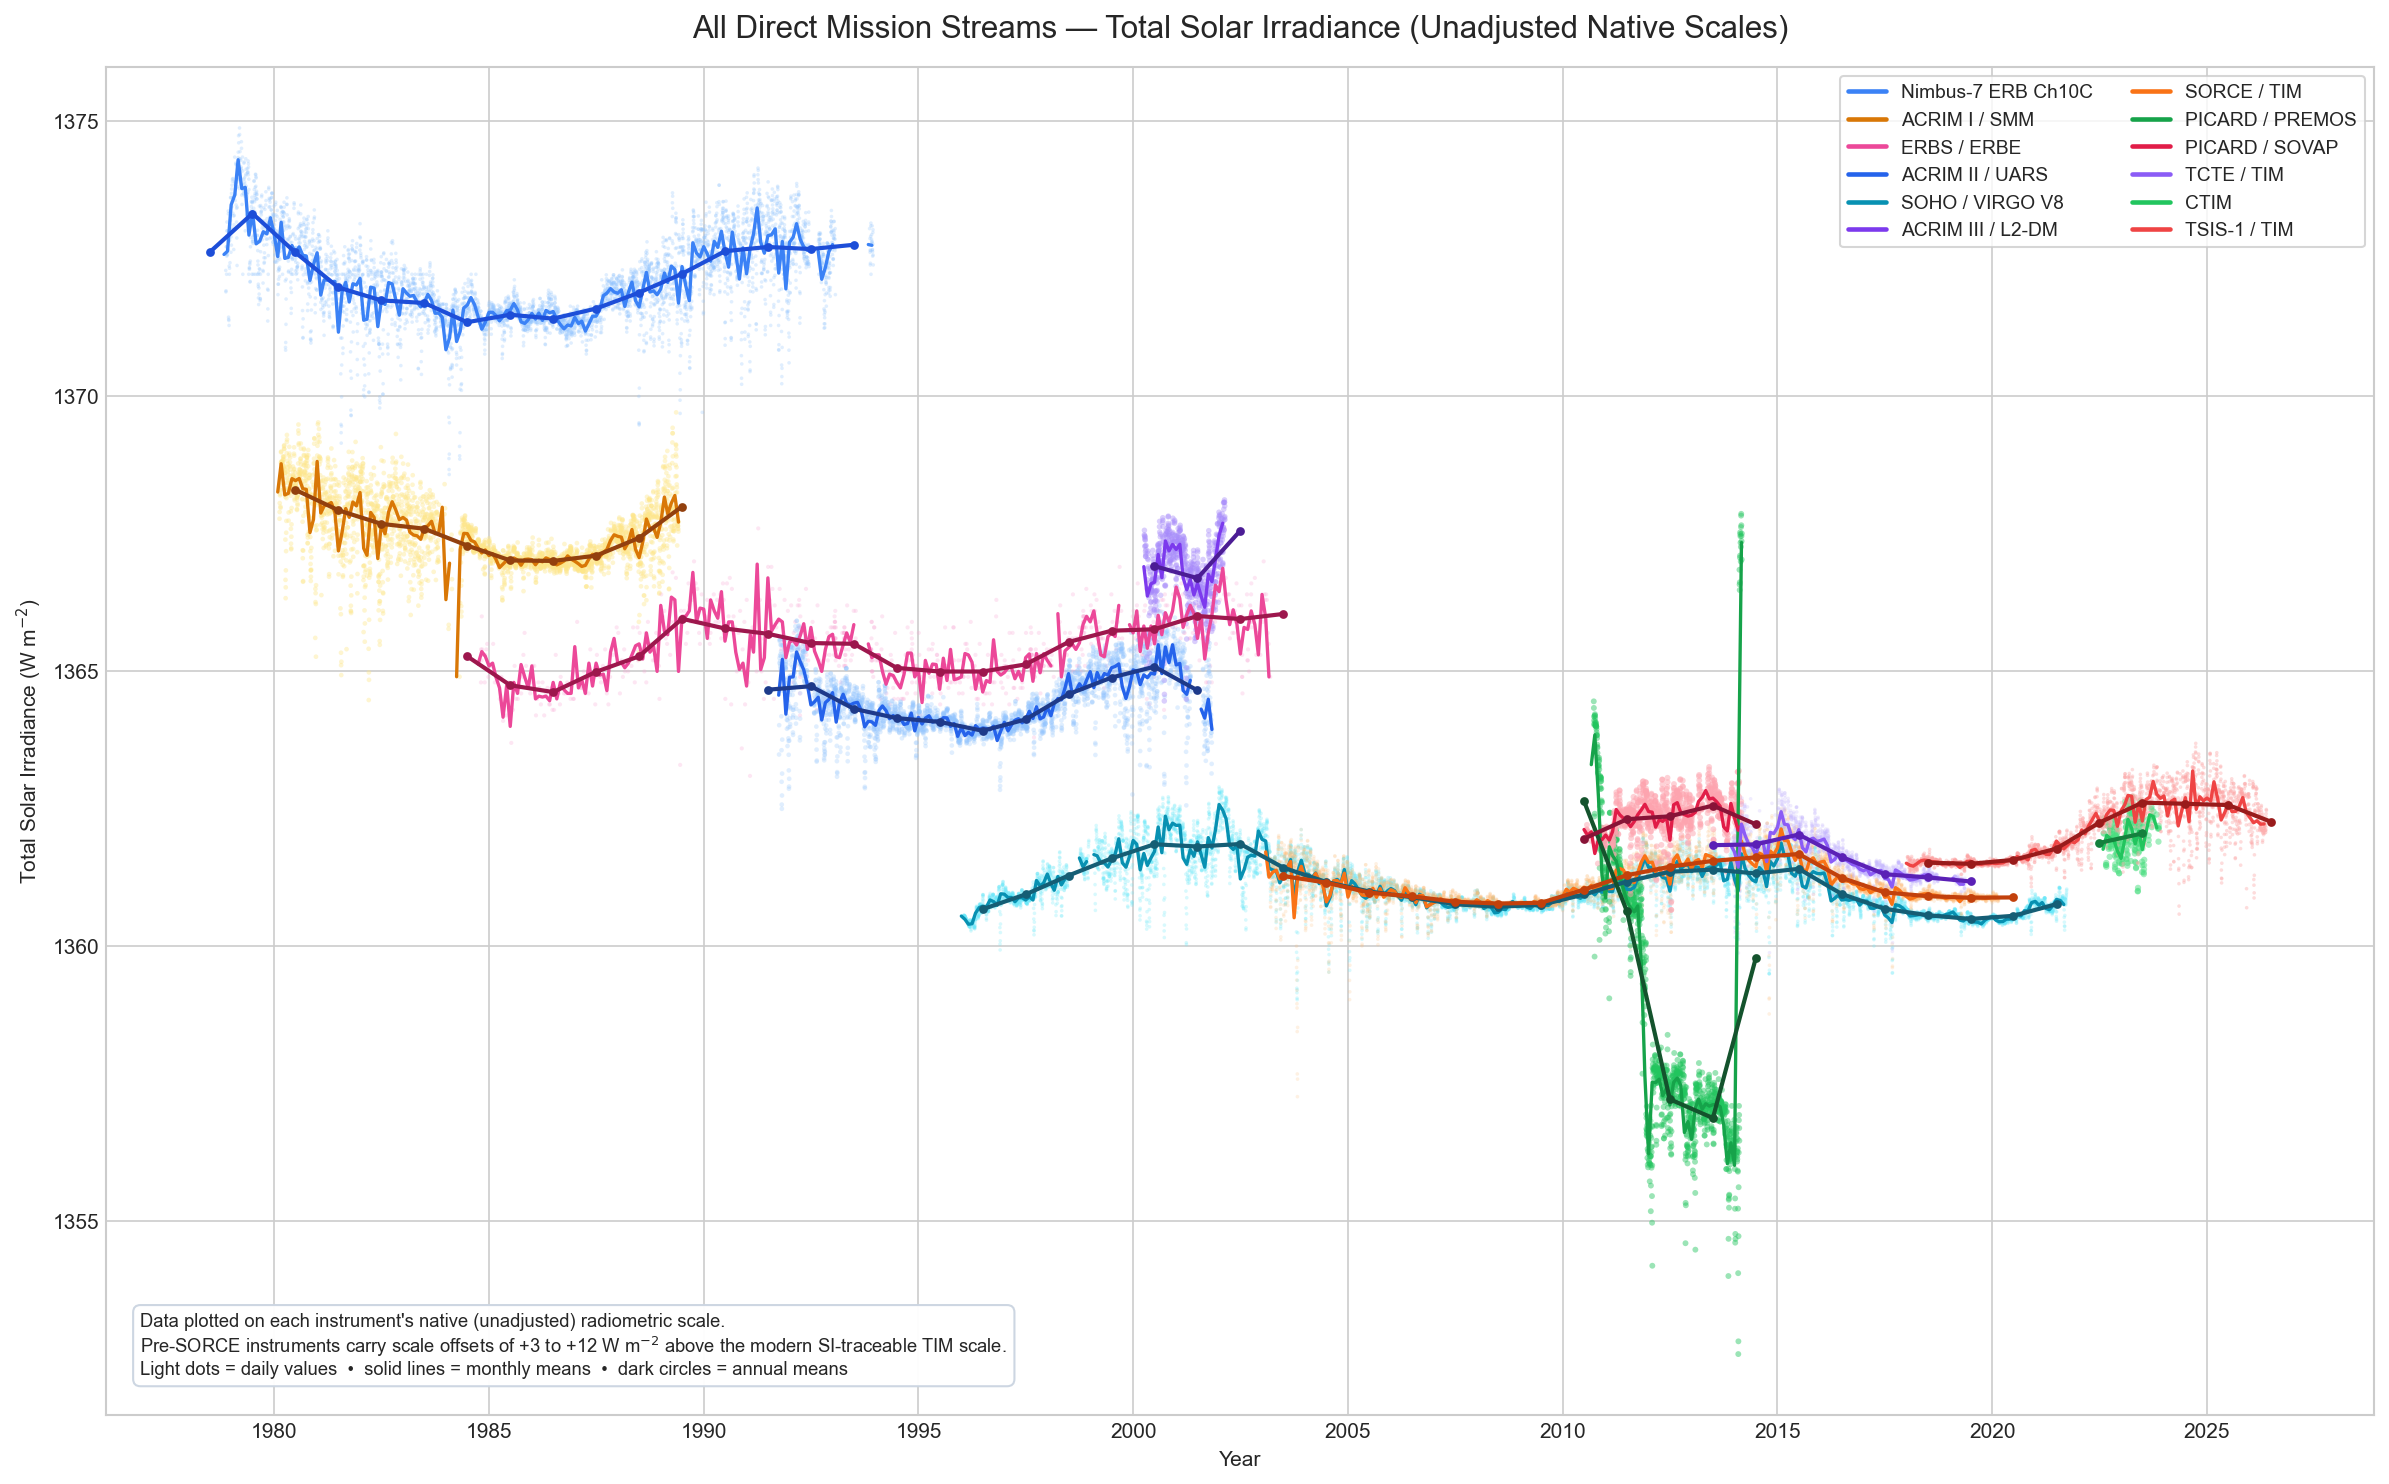
All direct mission streams overlaid on their native radiometric scales. The vertical spread between instrument families reflects real inter-instrument scale offsets rather than solar variability — pre-SORCE instruments (Nimbus-7, ACRIM I, ERBS, ACRIM II, ACRIM III) sit +3 to +12 W m−2 above the modern SI-traceable TIM scale adopted after Kopp & Lean (2011, GRL 38 L01706). The benchmark composites (PMOD, IRMB, ACRIM) on other panels apply inter-calibration corrections to reconcile these offsets.